

Neural Dynamics of Olfactory Perception: Low- and High-Frequency Modulations of Local Field Potential Spectra in Mice Revealed by an Oddball Stimulus
- PMID: 31191212
- PMCID: PMC6546879
- DOI: 10.3389/fnins.2019.00478
Neural Dynamics of Olfactory Perception: Low- and High-Frequency Modulations of Local Field Potential Spectra in Mice Revealed by an Oddball Stimulus
Abstract
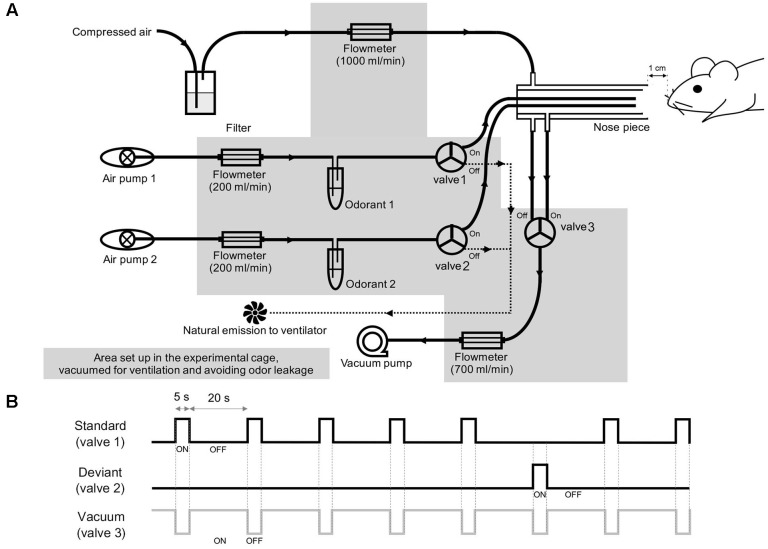
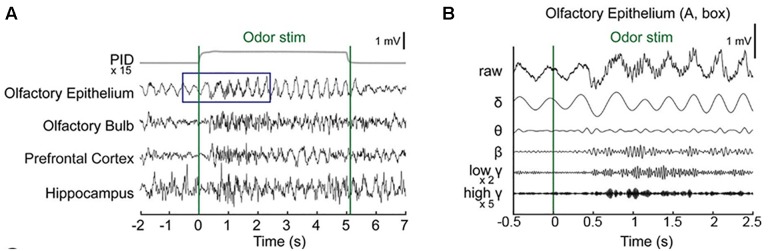
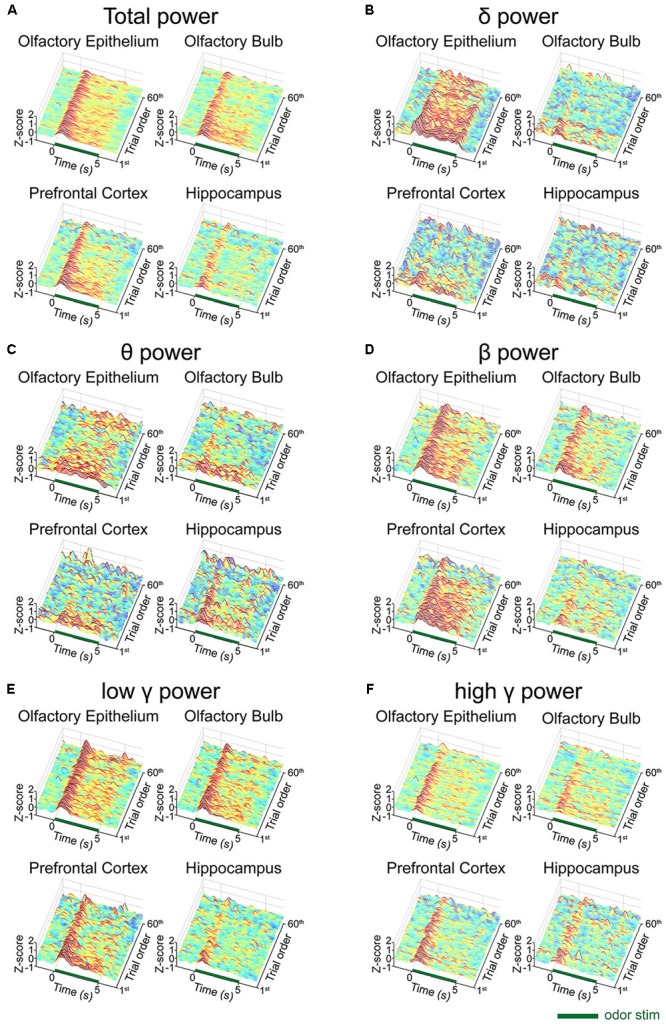
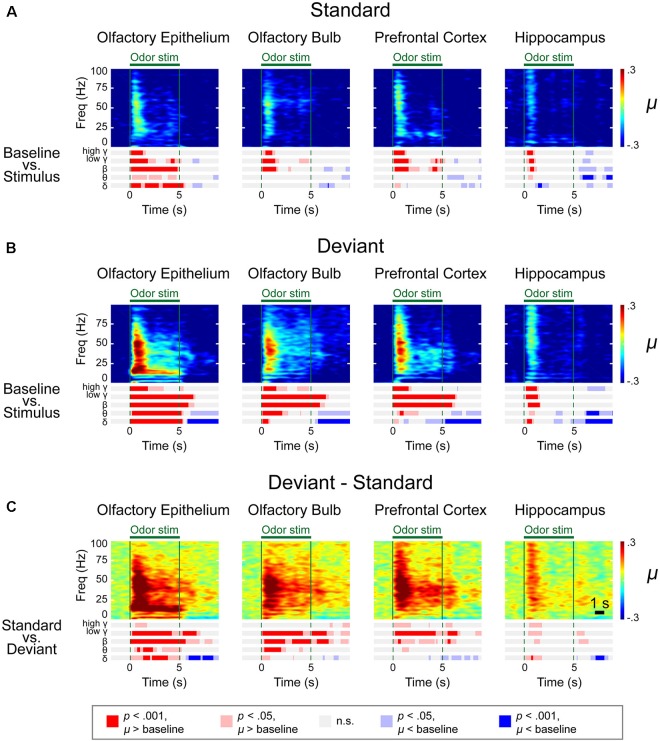
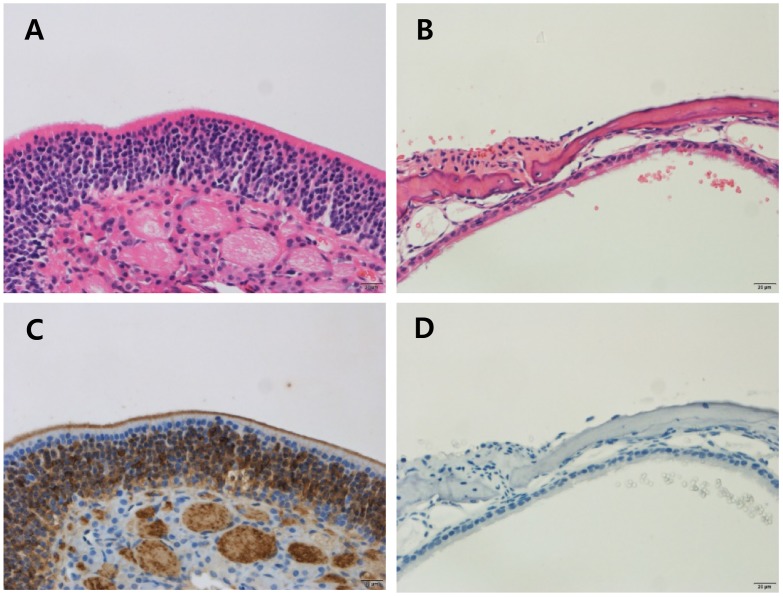
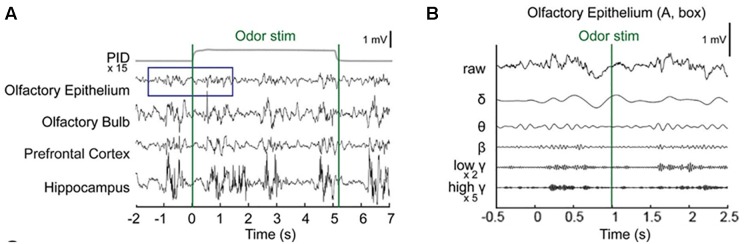
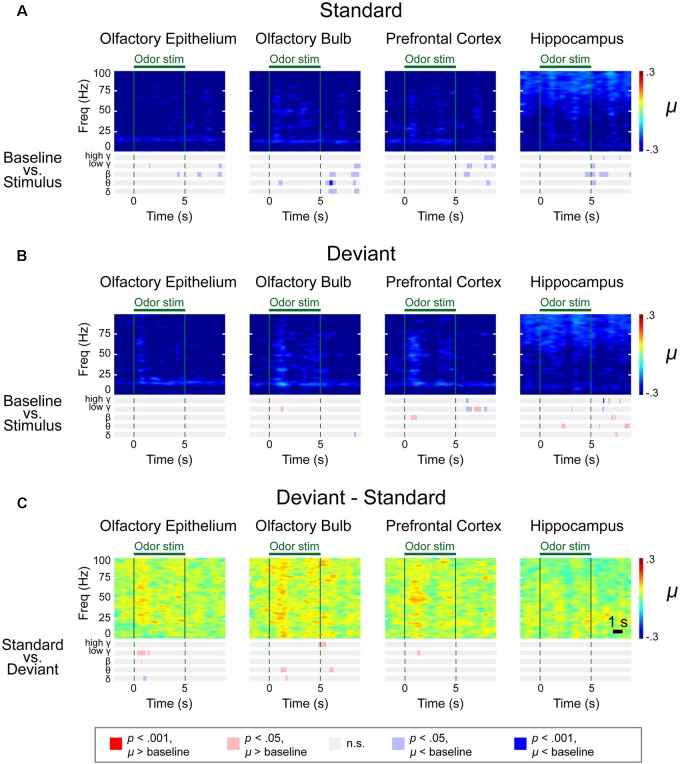
Recent brain connectome studies have evidenced distinct and overlapping brain regions involved in processing olfactory perception. However, neural correlates of hypo- or anosmia in olfactory disorder patients are poorly known. Furthermore, the bottom-up and top-down processing of olfactory perception have not been well-documented, resulting in difficulty in locating the disease foci of olfactory disorder patients. The primary aim of this study is to characterize the bottom-up process of the neural dynamics across peripheral and central brain regions in anesthetized mice. We particularly focused on the neural oscillations of local field potential (LFP) in olfactory epithelium (OE), olfactory blub (OB), prefrontal cortex (PFC), and hippocampus (HC) during an olfactory oddball paradigm in urethane anesthetized mice. Odorant presentations evoked neural oscillations across slow and fast frequency bands including delta (1-4 Hz), theta (6-10 Hz), beta (15-30 Hz), low gamma (30-50 Hz), and high gamma (70-100 Hz) in both peripheral and central nervous systems, and the increases were more prominent in the infrequently presented odorant. During 5 s odorant exposures, the oscillatory responses in power were persistent in OE, OB, and PFC, whereas neural oscillations of HC increased only for short time at stimulus onset. These oscillatory responses in power were insignificant in both peripheral and central regions of the ZnSO4-treated anosmia model. These results suggest that olfactory stimulation induce LFP oscillations both in the peripheral and central nervous systems and suggest the possibility of linkage of LFP oscillations in the brain to the oscillations in the peripheral olfactory system.
Keywords: anterior cingulate cortex; anterior olfactory; attention; local field potential; neural oscillations; oddball paradigm; olfaction; primary olfactory cortex.
Figures
Similar articles
-
Odorant modulation of neuronal activity and local field potential in sensory-deprived olfactory bulb.Neuroscience. 2009 Sep 15;162(4):1265-78. doi: 10.1016/j.neuroscience.2009.05.051. Epub 2009 May 27. Neuroscience. 2009. PMID: 19481588
-
Dorsal vs. ventral differences in fast Up-state-associated oscillations in the medial prefrontal cortex of the urethane-anesthetized rat.J Neurophysiol. 2017 Mar 1;117(3):1126-1142. doi: 10.1152/jn.00762.2016. Epub 2016 Dec 21. J Neurophysiol. 2017. PMID: 28003411 Free PMC article.
-
A Respiration-Coupled Rhythm in the Rat Hippocampus Independent of Theta and Slow Oscillations.J Neurosci. 2016 May 11;36(19):5338-52. doi: 10.1523/JNEUROSCI.3452-15.2016. J Neurosci. 2016. PMID: 27170130 Free PMC article.
-
Beta and gamma oscillatory activities associated with olfactory memory tasks: different rhythms for different functional networks?Front Behav Neurosci. 2014 Jun 23;8:218. doi: 10.3389/fnbeh.2014.00218. eCollection 2014. Front Behav Neurosci. 2014. PMID: 25002840 Free PMC article. Review.
-
Circuit oscillations in odor perception and memory.Prog Brain Res. 2014;208:223-51. doi: 10.1016/B978-0-444-63350-7.00009-7. Prog Brain Res. 2014. PMID: 24767485 Review.
Cited by
-
Dynamic switching of neural oscillations in the prefrontal-amygdala circuit for naturalistic freeze-or-flight.Proc Natl Acad Sci U S A. 2023 Sep 12;120(37):e2308762120. doi: 10.1073/pnas.2308762120. Epub 2023 Sep 5. Proc Natl Acad Sci U S A. 2023. PMID: 37669394 Free PMC article.
-
Cortical Microcircuit Mechanisms of Mismatch Negativity and Its Underlying Subcomponents.Front Neural Circuits. 2020 Mar 31;14:13. doi: 10.3389/fncir.2020.00013. eCollection 2020. Front Neural Circuits. 2020. PMID: 32296311 Free PMC article. Review.
-
Increases of Phosphorylated Tau (Ser202/Thr205) in the Olfactory Regions Are Associated with Impaired EEG and Olfactory Behavior in Traumatic Brain Injury Mice.Biomedicines. 2022 Apr 7;10(4):865. doi: 10.3390/biomedicines10040865. Biomedicines. 2022. PMID: 35453615 Free PMC article.
References
-
- Baba T., Kikuchi A., Hirayama K., Nishio Y., Hosokai Y., Kanno S. (2012). Severe olfactory dysfunction is predictive of dementia associated with Parkinson’s disease: a 3-year longitudinal study. Mov. Disord. 27 S33–S34. - PubMed
LinkOut - more resources
Full Text Sources
Miscellaneous