

A Simple Target Interception Task as Test for Activities of Daily Life Performance in Older Adults
- PMID: 31191226
- PMCID: PMC6545929
- DOI: 10.3389/fnins.2019.00524
A Simple Target Interception Task as Test for Activities of Daily Life Performance in Older Adults
Abstract
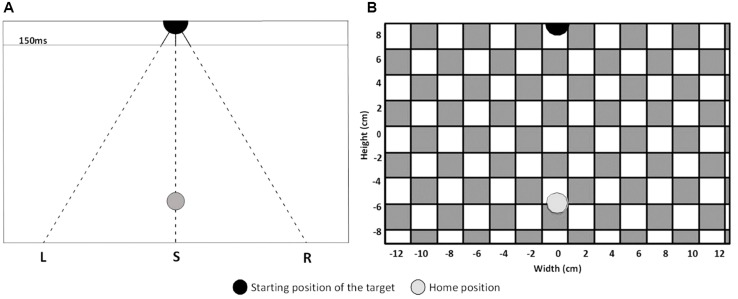
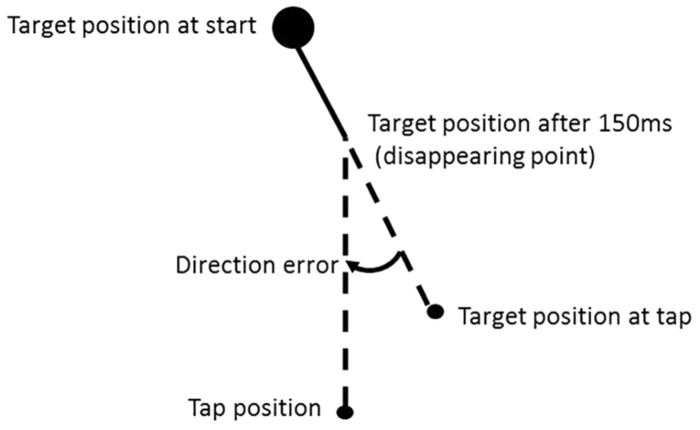
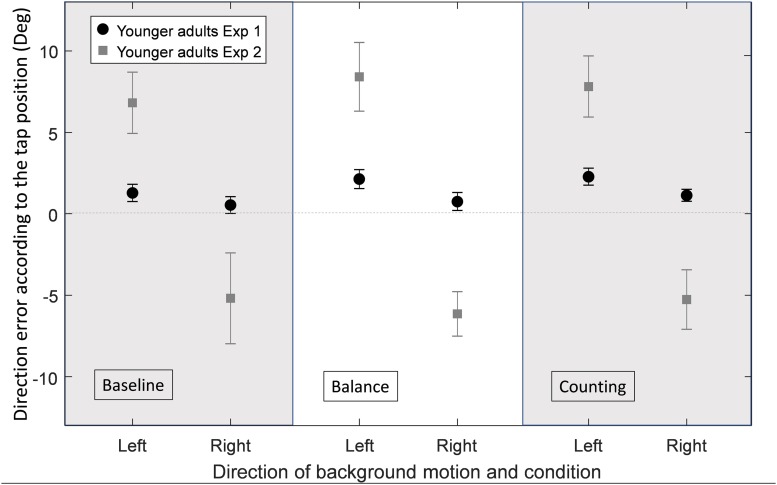
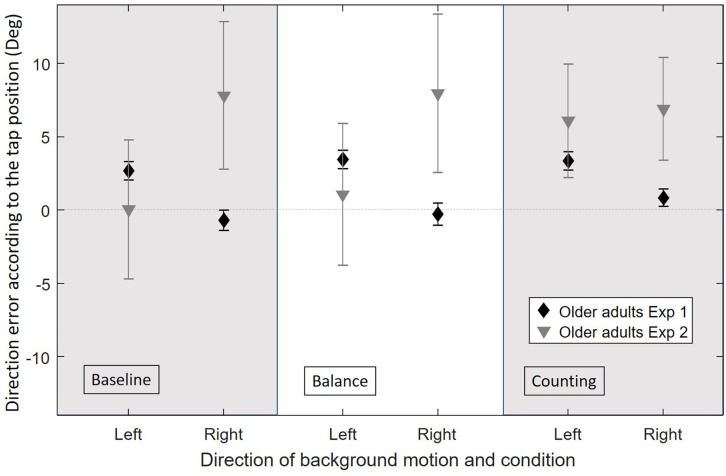
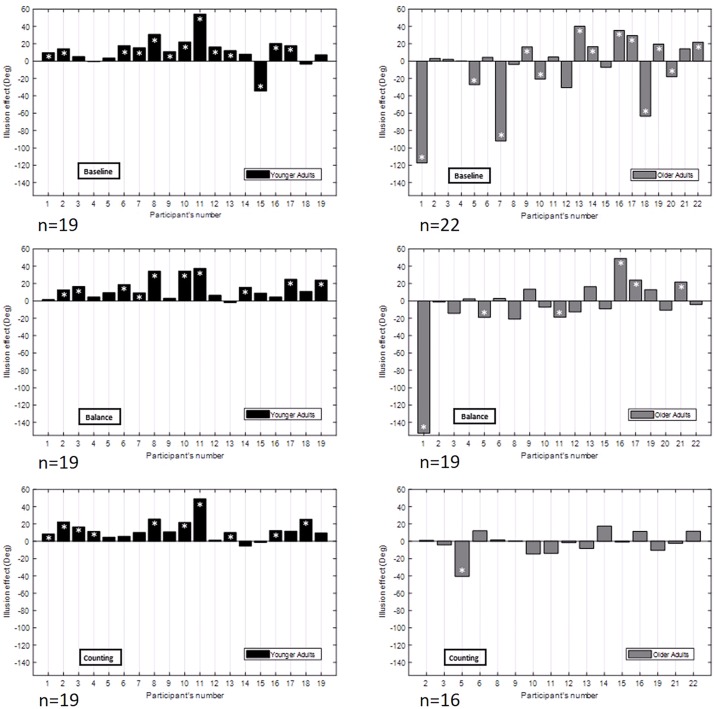
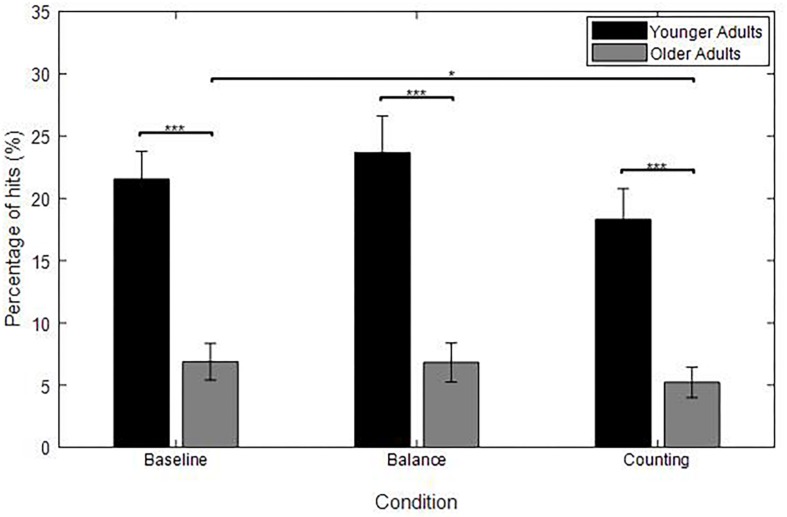
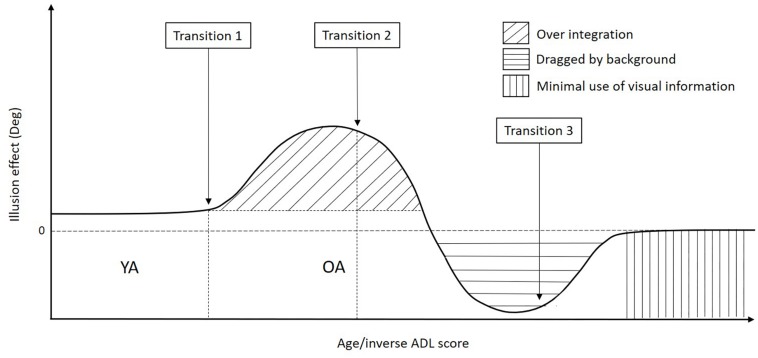
Previous research showed that a simple target interception task reveals differences between younger adults (YA) and older adults (OA) on a large screen under laboratory conditions. Participants intercept downward moving objects while a horizontally moving background creates an illusion of the object moving in the opposite direction of the background. OA are more influenced by this illusory motion than YA. OA seem to be less able to ignore irrelevant sensory information than YA. Since sensory integration relates to the ability to perform Activities of Daily Living (ADL), this interception task can potentially signal ADL issues. Here we investigated whether the results of the target interception task could be replicated using a more portable setup, i.e., a tablet instead of a large touch screen. For YA from the same, homogeneous population, the main effects were replicated although the task was more difficult in the tablet set-up. After establishing the tablet's validity, we analyzed the response patterns of OA that were less fit than the OA in previous research. We identified three different illusion patterns: a (large) illusion effect (indicating over integration), a reverse illusion effect, and no illusion effect. These different patterns are much more nuanced than previously reported for fit OA who only show over integration. We propose that the patterns are caused by differences in the samples of OA (OA in the current sample were older and had lower ADL scores), possibly modulated by increased task difficulty in the tablet setup. We discuss the effects of illusory background motion as a function of ADL scores using a transitional model. The first pattern commences when sensory integration capability starts to decrease, leading to a pattern of over-integration (illusion effect). The second pattern commences when compensatory mechanisms are not sufficient to counteract the effect of the background motion, leading to direction errors in the same direction as the background motion (reverse illusion). The third pattern commences when the task requirements are too high, leading OA to implement a probabilistic strategy by tapping toward the center of the screen.
Keywords: activities of daily living; aging; elderly; interception task; sensory integration.
Figures
Similar articles
-
Aging and Sensitivity to Illusory Target Motion With or Without Secondary Tasks.Multisens Res. 2018 Jan 1;31(3-4):227-249. doi: 10.1163/22134808-00002596. Multisens Res. 2018. PMID: 31264631
-
Effects of Aging in Multisensory Integration: A Systematic Review.Front Aging Neurosci. 2017 Mar 28;9:80. doi: 10.3389/fnagi.2017.00080. eCollection 2017. Front Aging Neurosci. 2017. PMID: 28400727 Free PMC article. Review.
-
Manual interception of moving targets. I. Performance and movement initiation.Exp Brain Res. 1997 Oct;116(3):406-20. doi: 10.1007/pl00005769. Exp Brain Res. 1997. PMID: 9372290 Clinical Trial.
-
Comparable Cerebral Oxygenation Patterns in Younger and Older Adults during Dual-Task Walking with Increasing Load.Front Aging Neurosci. 2016 Oct 20;8:240. doi: 10.3389/fnagi.2016.00240. eCollection 2016. Front Aging Neurosci. 2016. PMID: 27812334 Free PMC article.
-
The Metabolic Cost of Walking in healthy young and older adults - A Systematic Review and Meta Analysis.Sci Rep. 2019 Jul 10;9(1):9956. doi: 10.1038/s41598-019-45602-4. Sci Rep. 2019. PMID: 31292471 Free PMC article.
Cited by
-
Detection of scene-relative object movement and optic flow parsing across the adult lifespan.J Vis. 2020 Sep 2;20(9):12. doi: 10.1167/jov.20.9.12. J Vis. 2020. PMID: 32945848 Free PMC article.
References
LinkOut - more resources
Full Text Sources