. 2019 May 29:13:547.
doi: 10.3389/fnins.2019.00547. eCollection 2019.

Antiepileptic Effects of a Novel Non-invasive Neuromodulation Treatment in a Subject With Early-Onset Epileptic Encephalopathy: Case Report With 20 Sessions of HD-tDCS Intervention

Affiliations

Antiepileptic Effects of a Novel Non-invasive Neuromodulation Treatment in a Subject With Early-Onset Epileptic Encephalopathy: Case Report With 20 Sessions of HD-tDCS Intervention

Oded Meiron et al. Front Neurosci. .

Abstract

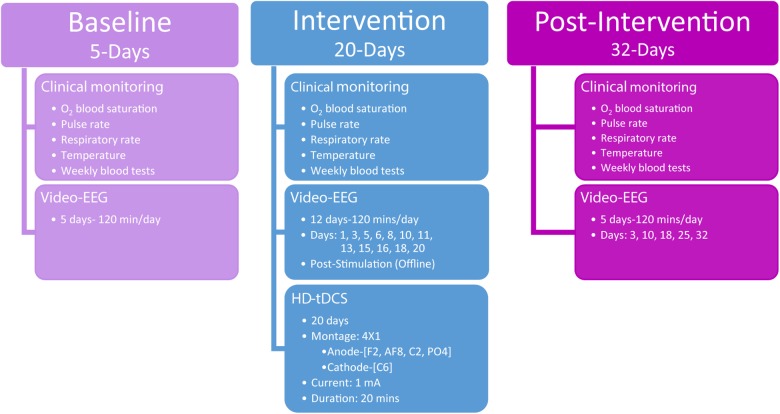
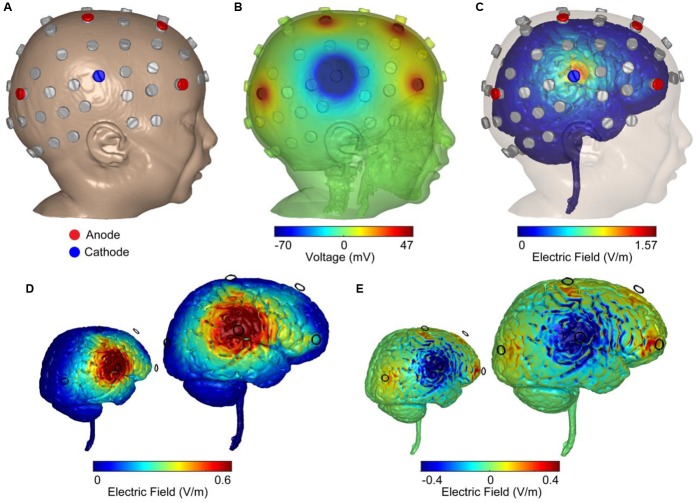
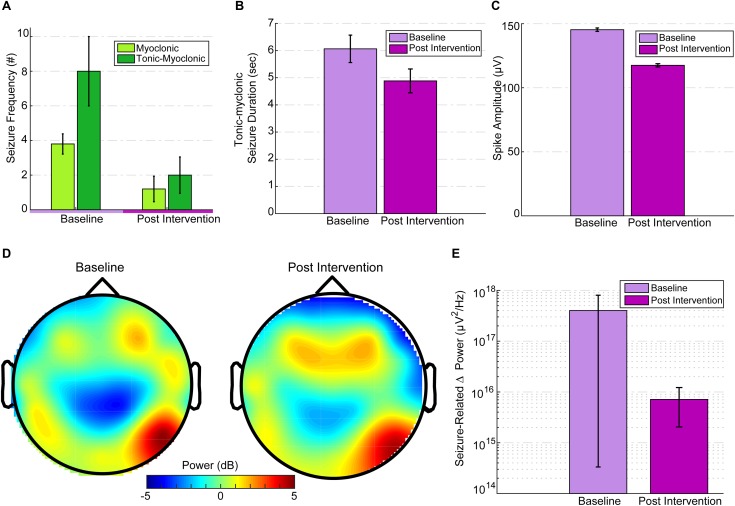
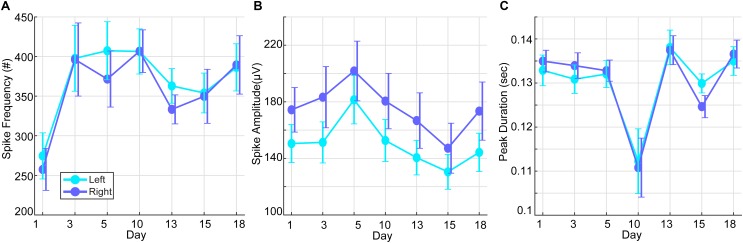
The current clinical investigation examined high-definition transcranial direct current stimulation (HD-tDCS) as a focal, non-invasive, anti-epileptic treatment in a child with early-onset epileptic encephalopathy. We investigated the clinical impact of repetitive (20 daily sessions) cathode-centered 4 × 1 HD-tDCS (1 mA, 20 min, 4 mm ring radius) over the dominant seizure-generating cortical zone in a 40-month-old child suffering from a severe neonatal epileptic syndrome known as Ohtahara syndrome (OS). Seizures and epileptiform activity were monitored and quantified using video-EEG over multiple days of baseline, intervention, and post-intervention periods. Primary outcome measures were changes in seizure frequency and duration on the last day of intervention versus the last baseline day, preceding the intervention. In particular, we examined changes in tonic spasms, tonic-myoclonic seizures (TM-S), and myoclonic seizures from baseline to post-intervention. A trend in TM-S frequency was observed indicating a reduction of 73% in TM-S frequency, which was non-significant [t(4) = 2.05, p = 0.1], and denoted a clinically significant change. Myoclonic seizure (M-S) frequency was significantly reduced [t(4) = 3.83, p = 0.019] by 68.42%, compared to baseline, and indicated a significant clinical change as well. A 73% decrease in interictal epileptic discharges (IEDs) frequency was also observed immediately after the intervention period, compared to IED frequency at 3 days prior to intervention. Post-intervention seizure-related peak delta desynchronization was reduced by 57%. Our findings represent a case-specific significant clinical response, reduction in IED, and change in seizure-related delta activity following the application of HD-tDCS. The clinical outcomes, as noted in the current study, encourage the further investigation of this focal, non-invasive neuromodulation procedure in other severe electroclinical syndromes (e.g., West syndrome) and in larger pediatric populations diagnosed with early-onset epileptic encephalopathy. Clinical Trial Registration: www.ClinicalTrials.gov, identifier NCT02960347, protocol ID: Meiron 2013-4.

Keywords: electroencephalography (EEG); high-definition transcranial direct current stimulation (HD-tDCS); interictal epileptic discharges (IEDs); neonatal epileptic encephalopathy; seizure.


Figures

FIGURE 1
FIGURE 1
Study overview detailing the three phases of assessments including baseline, intervention, and post-intervention. The timing and procedures administered are detailed for each of the three phases.
FIGURE 2
FIGURE 2
Computer simulations of 4 × 1 HD-tDCS intervention in an age-matched MRI-derived head model. (A) FEM MRI-derived model of an age-matched infant with electrode positioning is based on the 10/10 International system. Locations were used for recording EEG (gray) and stimulation (blue: cathode; red: anode). (B) Model-based prediction from FEM indicating scalp voltages across the head and at the anodes and cathode (false color: blue minimum = –70 mV, red maximum = 47 mV, green = 0 mV). (C) Model-based current flow field across the brain indicating maximal electric field under the cathode (false color: blue = 0 V/m, red = 1.57 V/m). (D) Finite-element model predictions of the normal electric field across the brain indicating electric field under the cathode (false color: blue = 0 V/m, red = 0.6 V/m). The color scheme maximized to 0.6 V/m (seen in adult brains under 2 mA of applied current) indicated a large right temporal lobe electric field. (E) Model-based radial electric field distribution across the brain indicating electric field under the cathode (false color: blue = –0.4 V/m- outward-radial electric field, inhibitory; red = 0.4 V/m-inward-radial electric field, excitatory).
FIGURE 3
FIGURE 3
EEG seizure baseline and post-intervention comparisons. (A) Seizure frequency for baseline and post intervention divided into M-S and TM-S. M-S frequency was significantly reduced (p = 0.019) and TM-S were reduced by more than 50% post intervention. (B) TM-S duration between baseline and post-intervention periods. (C) Mean spike amplitudes at baseline (3 days before intervention) versus intervention day 20 (immediately after the last treatment session). Spike amplitudes were significantly reduced (p < 0.001) compared to baseline. Spike amplitudes over the post-intervention period were significantly reduced (p < 0.001) compared to baseline. (D) Topographic scalp maps of normalized delta activity (2 Hz) comparing baseline (3 days before stimulation) and post intervention (3 days after intervention). (E) There was a significant difference (p = 0.01) between seizure-related mean peak delta desynchronization between baseline and post intervention.
FIGURE 4
FIGURE 4
Interictal epileptic discharges (spike waves and sharp waves) during the intervention period. (A) Mean spike frequency of the right and left hemisphere over days of stimulation (baseline prior to HD-tDCS: M = 8330.8, SD = 2017.86). (B) Mean spike amplitudes of the right and left hemisphere over days of stimulation (baseline prior to HD-tDCS: M = 142.26, SD = 6.03 μV). (C) Mean spike duration of the right and left hemisphere over days of stimulation (baseline prior to HD-tDCS: M = 0.093, SD = 0. 0044 s).

Similar articles

Cited by

References

    1. Alam M., Truong D. Q., Khadka N., Bikson M. (2016). Spatial and polarity precision of concentric high-definition transcranial direct current stimulation (HD-tDCS). Phys. Med. Biol. 61 4506–4521. 10.1088/0031-9155/61/12/4506 - DOI - PubMed
    1. Auvichayapat N., Rotenberg A., Gersner R., Ngodklang S., Tiamkao S., Tassaneeyakul W., et al. (2013). Transcranial direct current stimulation for treatment of refractory childhood focal epilepsy. Brain stimul. 6 696–700. 10.1016/j.brs.2013.01.009 - DOI - PubMed
    1. Auvichayapat N., Sinsupan K., Tunkamnerdthai O., Auvichayapat P. (2016). Transcranial direct current stimulation for treatment of childhood pharmacoresistant lennox-gastaut syndrome: a pilot study. Front. Neurol. 7:66. 10.3389/fneur.2016.00066 - DOI - PMC - PubMed
    1. Beal J. C., Cherian K., Moshe S. L. (2012). Early-onset epileptic encephalopathies: ohtahara syndrome and early myoclonic encephalopathy. Pediatr. Neurol. 47 317–323. 10.1016/j.pediatrneurol.2012.06.002 - DOI - PubMed
    1. Bikson M., Inoue M., Akiyama H., Deans J. K., Fox J. E., Miyakawa H., et al. (2004). Effects of uniform extracellular DC electric fields on excitability in rat hippocampal slices in vitro. J. Physiol. 557 175–190. 10.1113/jphysiol.2003.055772 - DOI - PMC - PubMed

Associated data