. 2019 May 29:13:554.
doi: 10.3389/fnins.2019.00554. eCollection 2019.

Impact of Sleep-Wake-Associated Neuromodulators and Repetitive Low-Frequency Stimulation on Human iPSC-Derived Neurons

Affiliations

Impact of Sleep-Wake-Associated Neuromodulators and Repetitive Low-Frequency Stimulation on Human iPSC-Derived Neurons

Remi Yokoi et al. Front Neurosci. .

Abstract

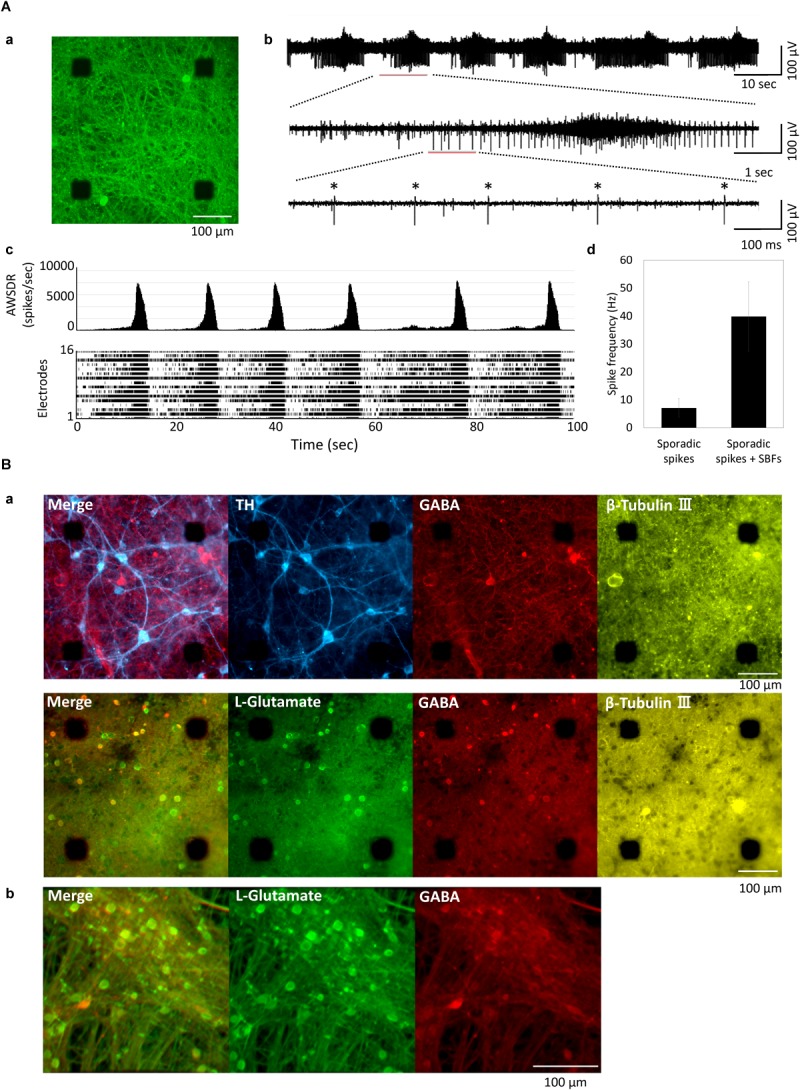
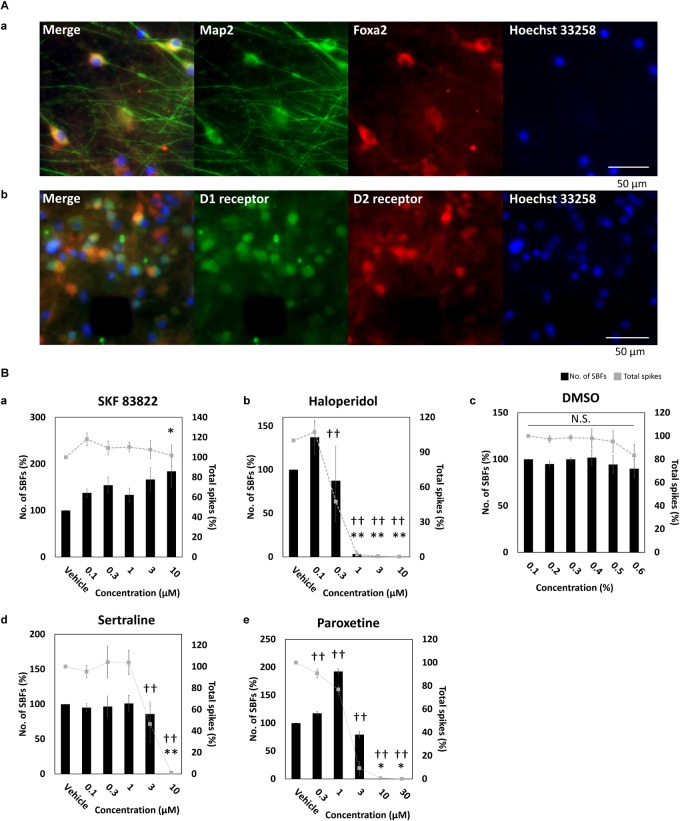
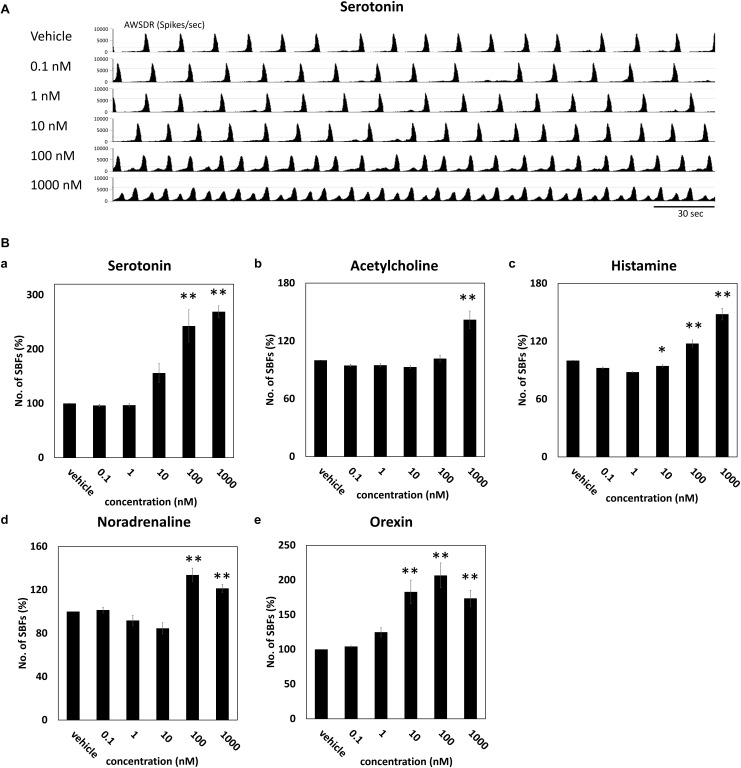
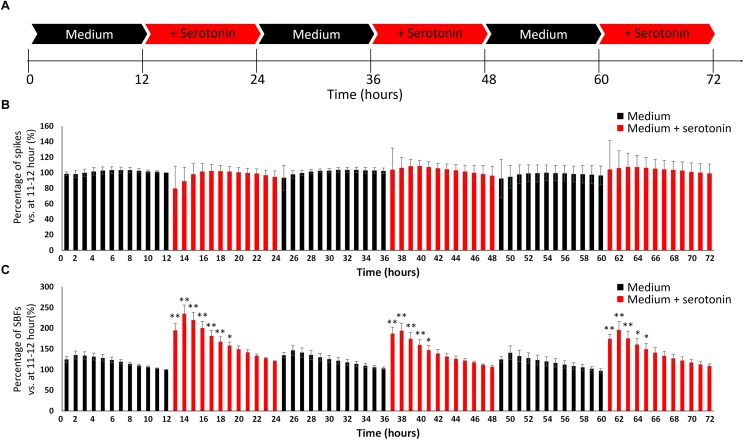
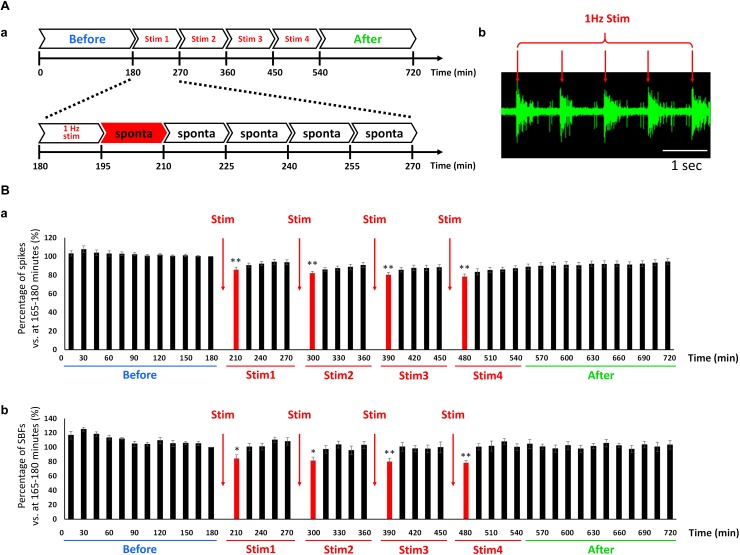
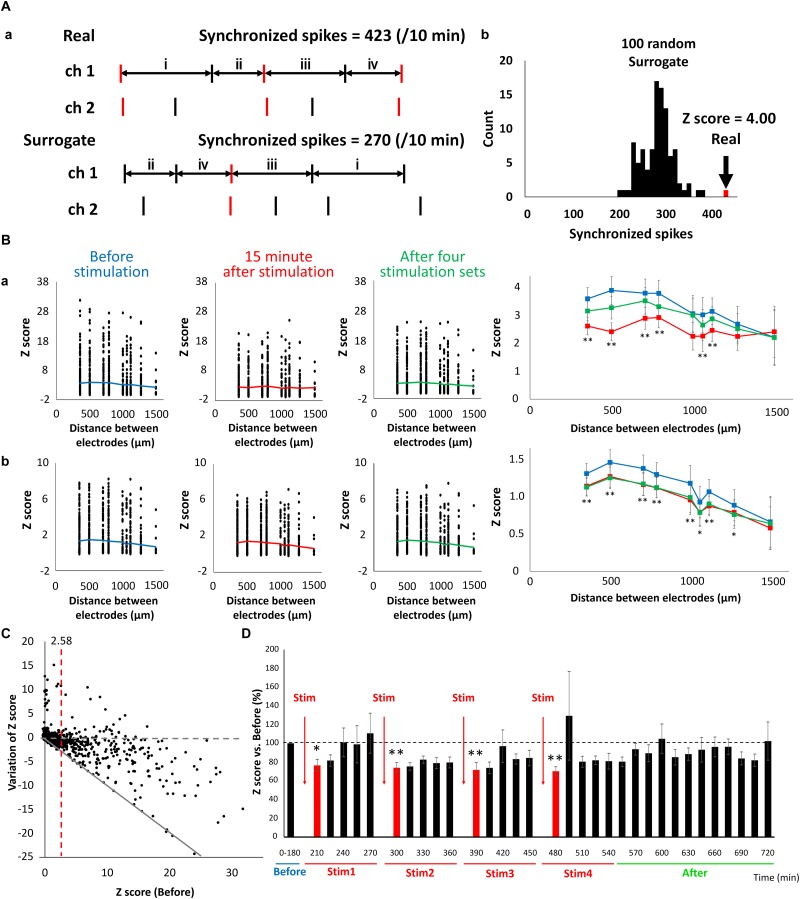
The cross-regional neurons in the brainstem, hypothalamus, and thalamus regulate the central nervous system, including the cerebral cortex, in a sleep-wake cycle-dependent manner. A characteristic brain wave, called slow wave, of about 1 Hz is observed during non-REM sleep, and the sleep homeostasis hypothesis proposes that the synaptic connection of a neural network is weakened during sleep. In the present study, in vitro human induced pluripotent stem cell (iPSC)-derived neurons, we investigated the responses to the neuromodulator known to be involved in sleep-wake regulation. We also determined whether long-term depression (LTD)-like phenomena could be induced by 1 Hz low-frequency stimulation (LFS), which is within the range of the non-REM sleep slow wave. A dose-dependent increase was observed in the number of synchronized burst firings (SBFs) when 0.1-1000 nM of serotonin, acetylcholine, histamine, orexin, or noradrenaline, all with increased extracellular levels during wakefulness, was administered to hiPSC-derived dopaminergic (DA) neurons. The number of SBFs repeatedly increased up to 5 h after 100 nM serotonin administration, inducing a 24-h rhythm cycle. Next, in human iPSC-derived glutamate neurons, 1 Hz LFS was administered four times for 15 min every 90 min. A significant reduction in both the number of firings and SBFs was observed in the 15 min immediately after LFS. Decreased frequency of spontaneous activity and recovery over time were repeatedly observed. Furthermore, we found that LFS attenuates synaptic connections, and particularly attenuates the strong connections in the neuronal network, and does not cause uniform attenuation. These results suggest sleep-wake states can be mimicked by cyclic neuromodulator administration and show that LTD-like phenomena can be induced by LFS in vitro human iPSC-derived neurons. These results could be applied in studies on the mechanism of slow waves during sleep or in an in vitro drug efficacy evaluation depending on sleep-wake state.

Keywords: circadian rhythms; human iPSC-derived neuron; long-term depression; low-frequency stimulation; micro-electrode array; neurotransmitters; non-REM sleep; wake.


Figures

FIGURE 1
FIGURE 1
Cultured of human iPSC-derived neurons. (A) Human iPSC-derived neurons on micro-electrode array (MEA) chip and spontaneous activities. (a) Immunofluorescent image of human iPSC-derived neurons (iCell DopaNeurons) at 51 weeks in vitro (WIV). Images show the neurons using β-tubulin III immunostaining. Scale bars = 100 μm. (b) Typical waveform of spontaneous firings on different time scales for one electrode at 11 WIV. Asterisk () indicates the firings of single neuron. (c) Array-wide spike detection rate (bin = 100 ms) and raster plots of spontaneous firing for 100 s at 16 electrodes per well. (d) Spike frequency of dopaminergic (DA) neuron. Spike frequency of spontaneous firings for 15 min was calculated for each electrode in cultured iCell DopaNeurons at 11 WIV (n = 16 electrodes/well, 4 wells). The analysis was divided into SBFs and non-SBF firings (sporadic spikes). In sporadic spikes, an electrode in which a spike was observed at 1 Hz or more was calculated as an active channel. (B) Immunofluorescence image of cultured human iPSC-derived neurons. (a) Immunofluorescence image of DA neurons on an MEA chip after 48 WIV. Tyrosine hydroxylase (TH, cyan), gamma-Aminobutyric acid (GABA, red), L-Glutamate (green), β-Tubulin (yellow). Scale bar = 100 μm. (b) Immunofluorescence image of glutamatergic neurons (iCell GlutaNeurons) on an MEA chip at 18 (WIV). Scale bar = 100 μm.
FIGURE 2
FIGURE 2
Characterization of dopaminergic neuron. (A) Immunofluorescent image of FOXA2, and D1 and D2 receptors in cultured iCell DopaNeurons at 23 WIV. (a) FOXA2 expression. MAP2 (green), FOXA2 (red), Hoechst 33258 (blue). Scale bars = 50 μm. (b) Dopamine receptor expression. D1 receptor (green), D2 receptor (red), Hoechst 33258 (blue). Scale bars = 50 μm. (B) The change of SBFs and spikes in SKF83822, haloperidol, DMSO, sertraline, and paroxetine administration. Spontaneous activity for 10 min was measured for each concentration. Black bars indicate SBFs and gray dashed lines indicate spikes. Data were analyzed using one-way ANOVA followed by post hoc Dunnett’s test [p < 0.05, ∗∗p < 0.01 vs. vehicle (SBFs), p < 0.05, ††p < 0.01 vs. vehicle (total spikes)]. (a) SKF 83822 (n = 6 wells). (b) Haloperidol (n = 5). (c) DMSO (n = 6). (d) Sertraline (n = 6). (e) Paroxetine (n = 6).
FIGURE 3
FIGURE 3
Neurotransmitter induced an increase of SBFs in human iPSC-derived dopaminergic neurons. Neurotransmitters were added to the culture medium at increasing concentrations (0.1, 1, 10, 100, and 1000 μM). Spontaneous firings were measured for 10 min before and after medication administration. (A) Typical array-wide spike detection rate of spontaneous firings for 5 min vehicle and serotonin administration. Scale bars = 30 s. (B) Changes in the number of SBFs versus vehicle (%) (n = 4 wells, One-way ANOVA and Holm test, p < 0.05, ∗∗p < 0.01 vs. vehicle). (a) Serotonin. (b) Acetylcholine. (c) Histamine. (d) Noradrenaline. (e) Orexin.
FIGURE 4
FIGURE 4
Evoking an awake-like rhythm through the periodic administration of serotonin. (A) Illustration of experimental scheme. The medium in cultured dopaminergic neurons was replaced with medium only (black arrows) or medium and serotonin (100 nM, red arrows) every 12 h. Two conditions were alternately repeated three times in a 12-h cycle, and spontaneous firings were measured for 72 h. Spontaneous firings were analyzed for every 1 h. (B) Changes in the number of spikes versus 11–12 h (%). (C) Changes in the number of SBFs versus 11–12 h (%). (n = 3, N is the number of wells and is the result of different culture samples. One-way ANOVA and post hoc Dunnett’s test, p < 0.05, ∗∗p < 0.01 vs. 11–12 h). Black bars show the data for medium only, and red bars show the data for medium and serotonin (100 nM) condition.
FIGURE 5
FIGURE 5
Change in the spontaneous firings via low frequency electrical stimulation (LFS) in cultured hiPSC-derived glutamatergic neurons. (A) Outline of experiment. (a) First, spontaneous activity was measured for 3 h before feeding the electrical stimulation (blue: before). The stimulus set (single set = 90 min) was subsequently fed to the network four times (red: Stim 1–4). The first 15 min of each set entailed electrical stimulation at 1 Hz and the remaining 75 min entailed the measurement of spontaneous activity. After performing four sets of stimulations (Stim 1–4), spontaneous activity was measured for 3 h (green: after). (b) Typical evoked responses during LFS. Scale bar = 1 s. Red arrow shows stimulus time and stimulation artifacts. (B) Change in the spontaneous firings after LFS at 6 WIV (n = 8). Black bars show the data for every 15 min, and red bars show the data for 15 min immediately after LFS. (a) Number of spikes vs. 165–180 min (%). (b) Number of SBFs vs. 165–180 min (%). Data were analyzed using one-way ANOVA followed by post hoc Dunnett’s test (p < 0.05, ∗∗p < 0.01 vs. before).
FIGURE 6
FIGURE 6
Reduction of connection strength in neuronal network caused by LFS. (A) Count of synchronized spikes between two electrodes. The number of synchronized spikes for every 15 min was counted within a 100 ms spikes (red). (a) Typical spike patterns of two electrodes (top). Each vertical line represents each spike. Typical surrogate dataset was generated by transposing the interspike intervals (ISIs) at random within an electrode (bottom). (b) Histogram of number of synchronized spikes. A real synchronized spikes is indicated by the arrow, which was compared with the distribution of synchronized spikes computed from the corresponding 100 surrogate datasets (black histogram). Based on the distribution of the surrogate datasets, the Z-score of the real data was computed to be 4.00. (B) The distribution of Z-score for each electrode distance (n = 120 pairs/well × 8 well = 960). The black plot shows the Z-score of each pair of electrodes; the polygonal line shows its average; (a) shows the data of sporadic firings that are not synchronized (sporadic); and (b) shows the data of synchronized bursts (burst) (blue; before, red; 15 min immediately after LFS, green; after 4 stimulation sets, n = 8). Right graphs show the average of Z-score before, 15 min immediately after LFS and after 4 stimulation sets in sporadic firings (upper) and burst firings (lower), respectively (two-tailed paired t-test, p < 0.05, ∗∗p < 0.01 vs. before stimulation). (C) Distribution of variation of Z-score in sporadic spikes before and after LFS (n = 120 pairs/well × 8 well = 960). Variation value of Z-score defined Z-score (15 min immediately after LFS)—Z-score (before LFS). Gray dashed line shows variation of Z-score was zero (not affected by LFS), and gray line shows Z-score became zero after LFS. Red line indicates Z-score (before stimulation) = 2.58, which represents a significance level of P < 0.05. (D) Change in the Z-score versus before (%) (sporadic spikes, n = 8). Black bars show Z-score for every 15 min, and red bars show Z-score for 15 min immediately after LFS. Data were analyzed using one-way ANOVA followed by post hoc Dunnett’s test (p < 0.05, ∗∗p < 0.01 vs. before).

Similar articles

Cited by

References

    1. Adamantidis A. R., Zhang F., Aravanis A. M., Deisseroth K., De Lecea L. (2007). Neural substrates of awakening probed with optogenetic control of hypocretin neurons. Nature 450 420–424. 10.1038/nature06310 - DOI - PMC - PubMed
    1. Ang S. L. (2009). Foxa1 and Foxa2 transcription factors regulate differentiation of midbrain dopaminergic neurons. Adv. Exp. Med. Biol. 651 58–65. 10.1007/978-1-4419-0322-8_5 - DOI - PubMed
    1. Berger R. J., Phillips N. H. (1995). Energy conservation and sleep. Behav. Brain Res. 69 65–73. 10.1016/0166-4328(95)00002-b - DOI - PubMed
    1. Carter M. E., Yizhar O., Chikahisa S., Nguyen H., Adamantidis A., Nishino S., et al. (2010). Tuning arousal with optogenetic modulation of locus coeruleus neurons. Nat. Neurosci. 13 1526–1533. 10.1038/nn.2682 - DOI - PMC - PubMed
    1. Charles B., Nemeroff (2004). The biochemical basis of neuropharmacology. Am. J. Psychiatry 161 379–379.

LinkOut - more resources