

Neural Correlates of Anesthesia in Newborn Mice and Humans
- PMID: 31191258
- PMCID: PMC6538977
- DOI: 10.3389/fncir.2019.00038
Neural Correlates of Anesthesia in Newborn Mice and Humans
Abstract
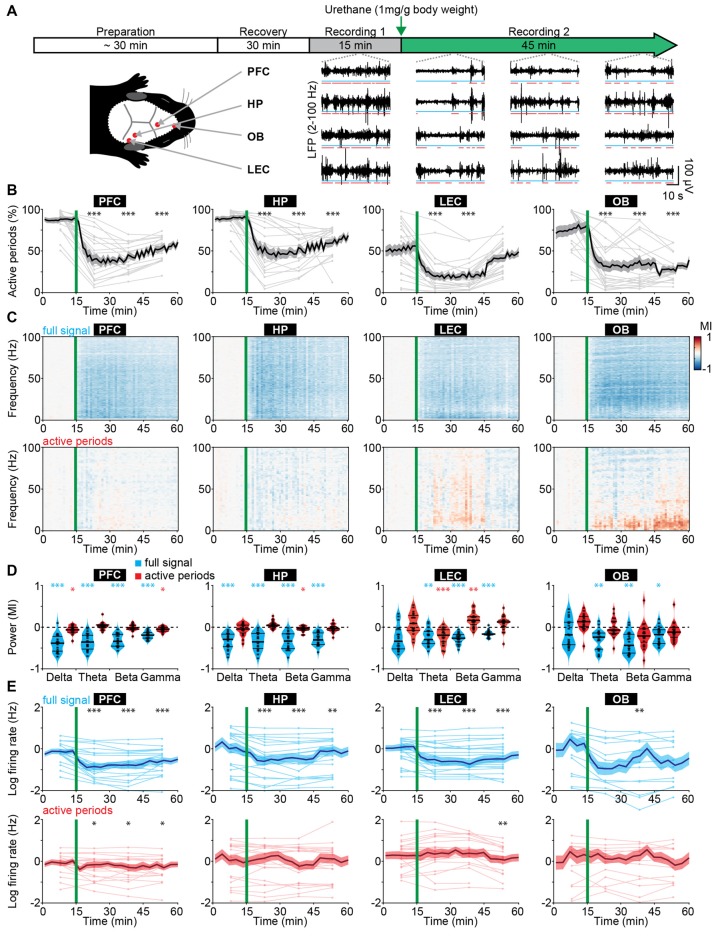
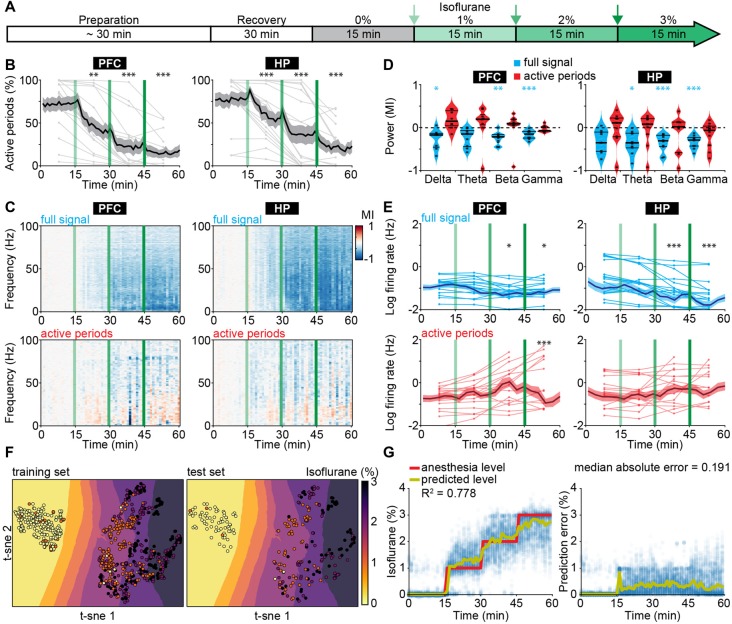
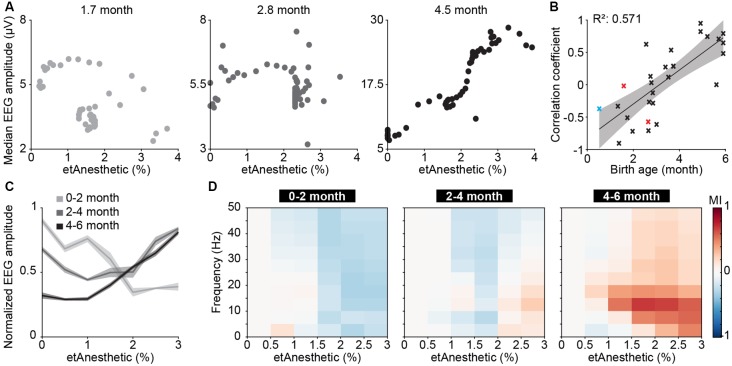
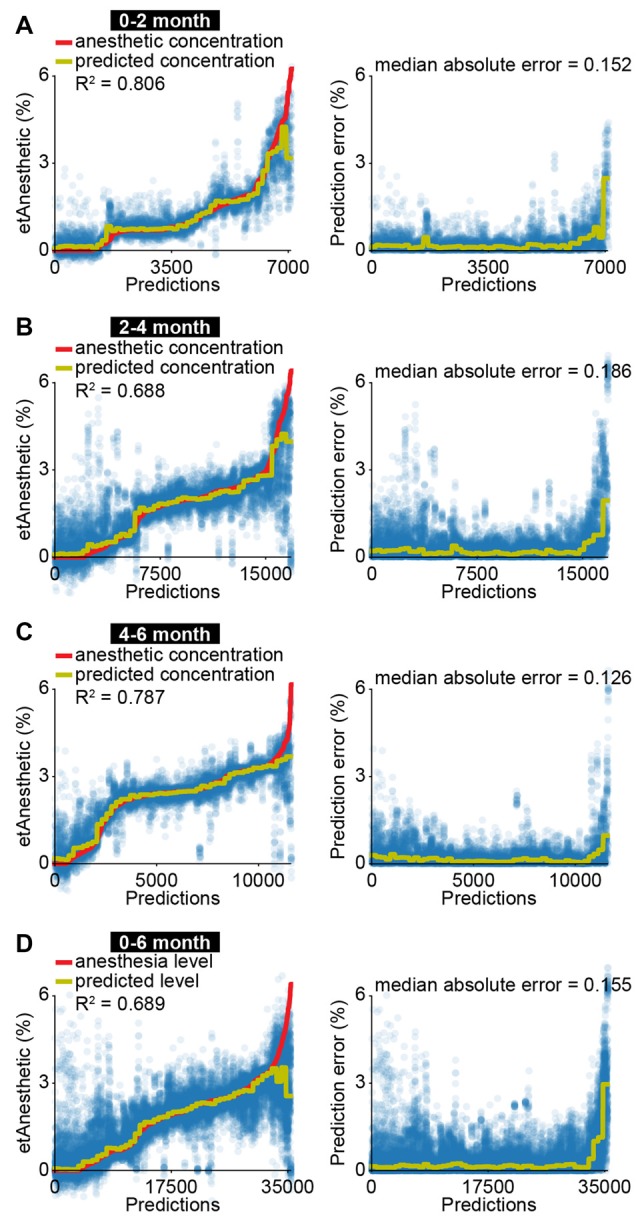
Monitoring the hypnotic component of anesthesia during surgeries is critical to prevent intraoperative awareness and reduce adverse side effects. For this purpose, electroencephalographic (EEG) methods complementing measures of autonomic functions and behavioral responses are in use in clinical practice. However, in human neonates and infants existing methods may be unreliable and the correlation between brain activity and anesthetic depth is still poorly understood. Here, we characterized the effects of different anesthetics on brain activity in neonatal mice and developed machine learning approaches to identify electrophysiological features predicting inspired or end-tidal anesthetic concentration as a proxy for anesthetic depth. We show that similar features from EEG recordings can be applied to predict anesthetic concentration in neonatal mice and humans. These results might support a novel strategy to monitor anesthetic depth in human newborns.
Keywords: EEG; LFP; anesthesia; development; human; machine learning; mouse; network dynamics.
Figures
Similar articles
-
Calculations of consciousness: electroencephalography analyses to determine anesthetic depth.Curr Opin Anaesthesiol. 2018 Aug;31(4):431-438. doi: 10.1097/ACO.0000000000000618. Curr Opin Anaesthesiol. 2018. PMID: 29847364 Review.
-
Depth of anesthesia monitoring.Anesthesiol Clin. 2006 Dec;24(4):793-822. doi: 10.1016/j.atc.2006.08.006. Anesthesiol Clin. 2006. PMID: 17342965 Review.
-
MORPhA Scale: Behavioral and electroencephalographic validation of a rodent anesthesia scale.J Neurosci Methods. 2019 Aug 1;324:108304. doi: 10.1016/j.jneumeth.2019.05.013. Epub 2019 May 26. J Neurosci Methods. 2019. PMID: 31141704
-
Monitoring the depth of anesthesia using entropy features and an artificial neural network.J Neurosci Methods. 2013 Aug 15;218(1):17-24. doi: 10.1016/j.jneumeth.2013.03.008. Epub 2013 Apr 6. J Neurosci Methods. 2013. PMID: 23567809
-
Processed electroencephalogram in depth of anesthesia monitoring.Curr Opin Anaesthesiol. 2009 Oct;22(5):553-9. doi: 10.1097/ACO.0b013e3283304032. Curr Opin Anaesthesiol. 2009. PMID: 19652597 Review.
Cited by
-
Gamma activity accelerates during prefrontal development.Elife. 2020 Nov 18;9:e56795. doi: 10.7554/eLife.56795. Elife. 2020. PMID: 33206597 Free PMC article.
-
Anesthetics fragment hippocampal network activity, alter spine dynamics, and affect memory consolidation.PLoS Biol. 2021 Apr 1;19(4):e3001146. doi: 10.1371/journal.pbio.3001146. eCollection 2021 Apr. PLoS Biol. 2021. PMID: 33793545 Free PMC article.
-
Network instability dynamics drive a transient bursting period in the developing hippocampus in vivo.Elife. 2022 Dec 19;11:e82756. doi: 10.7554/eLife.82756. Elife. 2022. PMID: 36534089 Free PMC article.
-
An increase of inhibition drives the developmental decorrelation of neural activity.Elife. 2022 Aug 17;11:e78811. doi: 10.7554/eLife.78811. Elife. 2022. PMID: 35975980 Free PMC article.
-
Contribution of Interneuron Subtype-Specific GABAergic Signaling to Emergent Sensory Processing in Mouse Somatosensory Whisker Barrel Cortex.Cereb Cortex. 2022 Jun 7;32(12):2538-2554. doi: 10.1093/cercor/bhab363. Cereb Cortex. 2022. PMID: 34613375 Free PMC article.
References
-
- Ackman J. B., Zeng H., Crair M. C. (2014). Structured dynamics of neural activity across developing neocortex. BioRxiv [Preprint]. 10.1101/012237 - DOI
-
- Bettinardi R. G., Tort-Colet N., Ruiz-Mejias M., Sanchez-Vives M. V., Deco G. (2015). Gradual emergence of spontaneous correlated brain activity during fading of general anesthesia in rats: evidences from fMRI and local field potentials. Neuroimage 114, 185–198. 10.1016/j.neuroimage.2015.03.037 - DOI - PMC - PubMed
Publication types
MeSH terms
Substances
LinkOut - more resources
Full Text Sources
Medical