. 2019 May 28:13:40.
doi: 10.3389/fncir.2019.00040. eCollection 2019.

Divisive Inhibition Prevails During Simultaneous Optogenetic Activation of All Interneuron Subtypes in Mouse Primary Visual Cortex

Affiliations

Divisive Inhibition Prevails During Simultaneous Optogenetic Activation of All Interneuron Subtypes in Mouse Primary Visual Cortex

Tony G J Ingram et al. Front Neural Circuits. .

Abstract

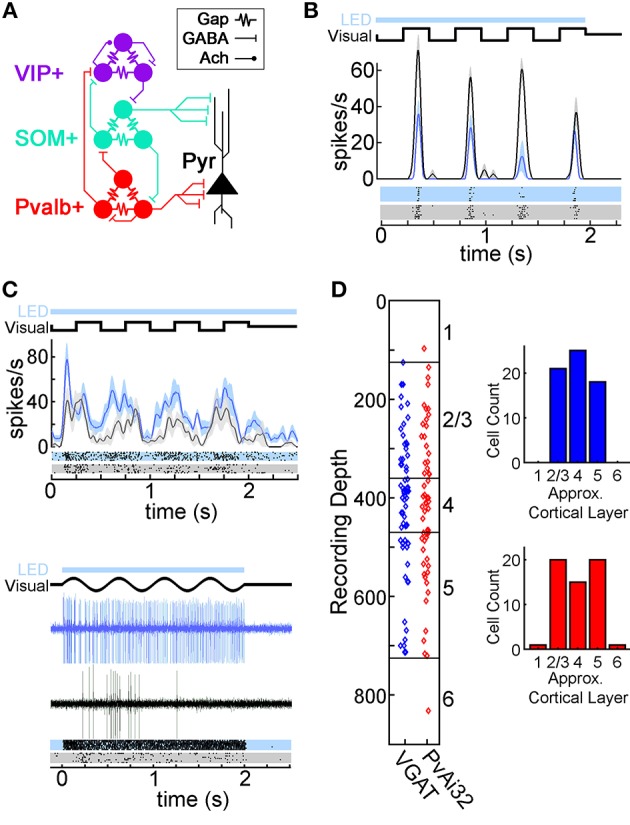
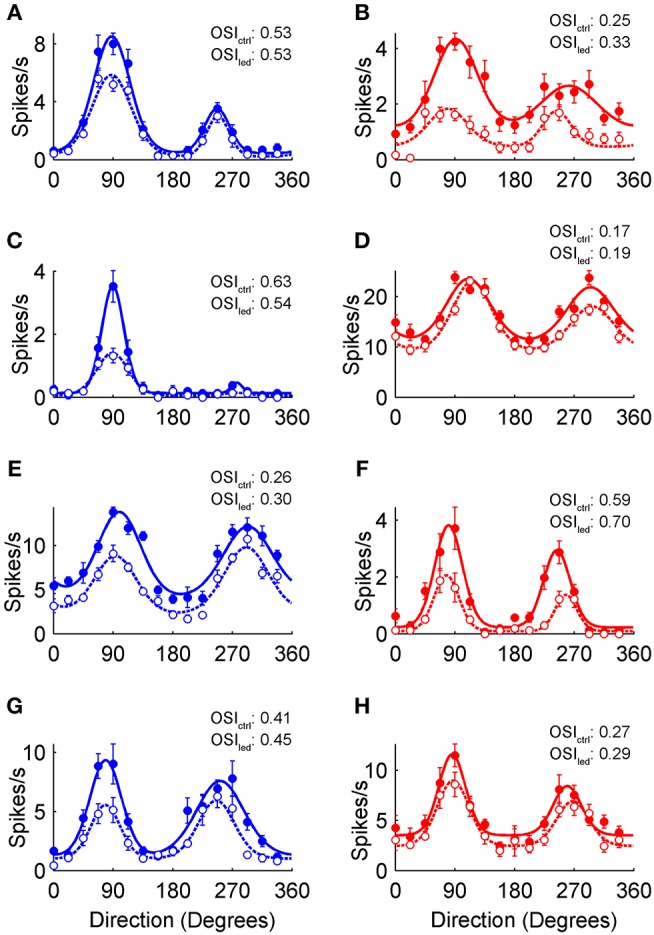
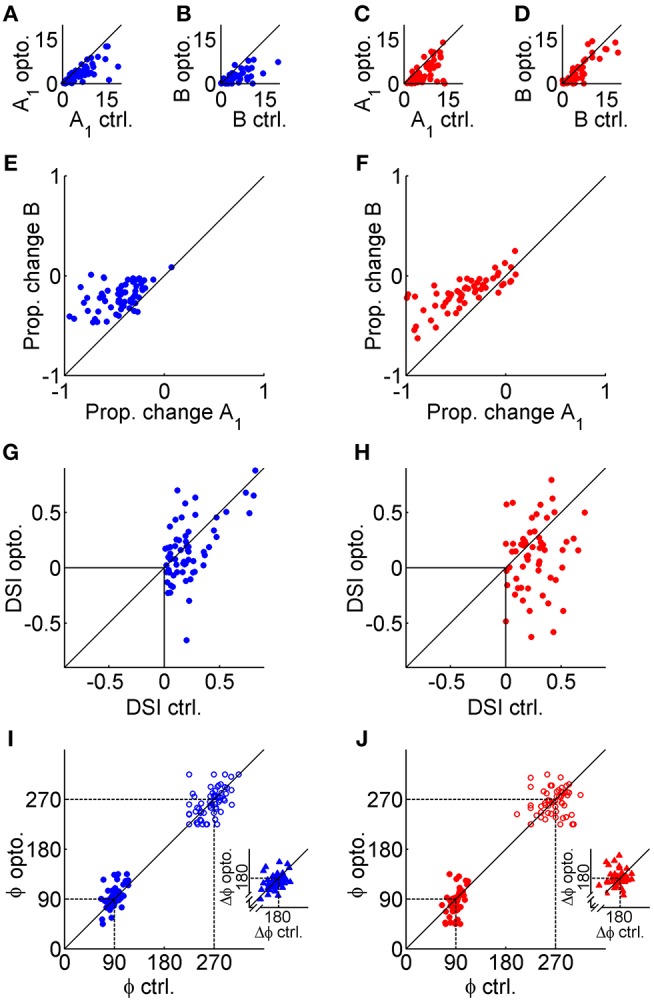
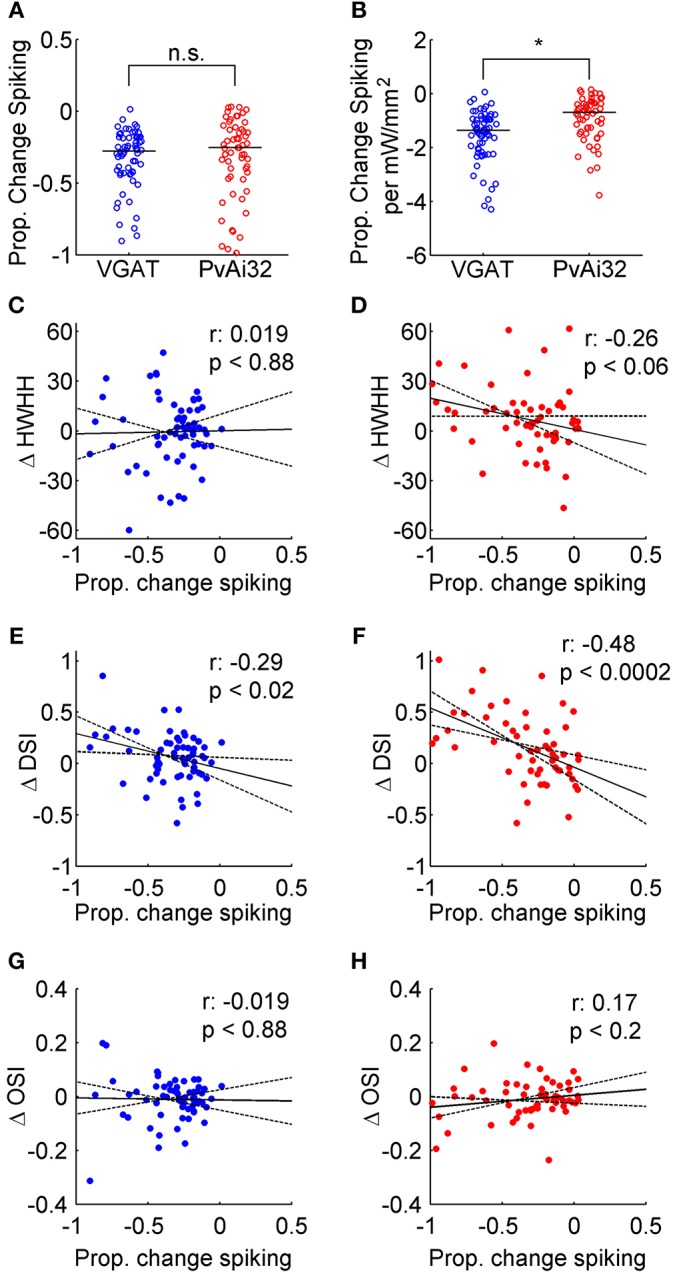
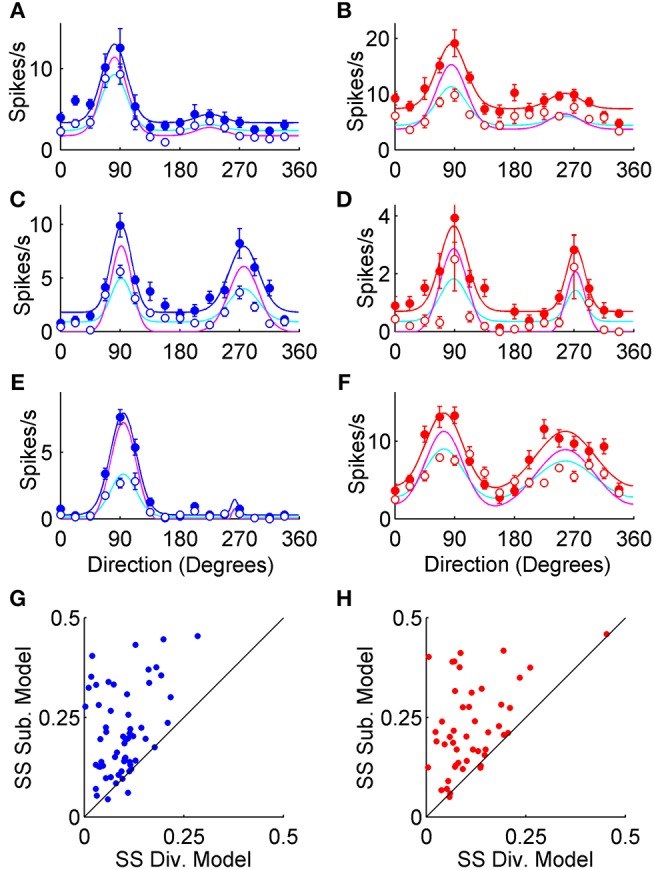
The mouse primary visual cortex (V1) has become an important brain area for exploring how neural circuits process information. Optogenetic tools have helped to outline the connectivity of a local V1 circuit comprising excitatory pyramidal neurons and several genetically-defined inhibitory interneuron subtypes that express parvalbumin, somatostatin, or vasoactive intestinal peptide. Optogenetic modulation of individual interneuron subtypes can alter the visual responsiveness of pyramidal neurons with distinct forms of inhibition and disinhibition. However, different interneuron subtypes have potentially opposing actions, and the potency of their effects relative to each other remains unclear. Therefore, in this study we simultaneously optogenetically activated all interneuron subtypes during visual processing to explore whether any single inhibitory effect would predominate. This aggregate interneuron activation consistently inhibited pyramidal neurons in a divisive manner, which was essentially identical to the pattern of inhibition produced by activating parvalbumin-expressing interneurons alone.

Keywords: V1; electrophysiology; interneuron; mouse; optogenetics; orientation tuning; primary visual cortex; vision.


Figures

Figure 1
Figure 1
Optogenetic modulation of V1 neurons in transgenic mice. (A) Diagram of the proposed wiring of V1 local interneuron circuits described using in vitro methods (Pfeffer et al., ; Crandall and Connors, ; Karnani et al., 2016a). Pyramidal neurons (Pyr; black), and interneurons expressing parvalbumin (Pvalb+; red), somatostatin (SOM+; teal), and vasoactive intestinal peptide (VIP+; purple) are connected with electrical synapses (Gap) as well as GABAergic (GABA) and cholinergic (Ach) chemical synapses. (B) Spike Density Functions (SDFs) and rasters for a putative pyramidal neuron's response to drifting square wave gratings with (azure) or without (black) LED illumination. (C) Two photostimulated Pvalb+ neurons recorded in PvAi32 mice in the same format as (B). The SDFs and rasters for the top neuron show low intensity photostimulation elevated firing while maintaining important temporal features of visually evoked responses (see Methods), as well as eliciting several low latency spikes. The spike traces and rasters for the bottom neuron illustrate robust and low latency firing evoked by high intensity photostimulation (which was not used in the main dataset). For the example cells in (B) and (C), the timing of photostimulation (LED; light blue bar) and the visual stimulus (Visual; thick black line depicting the change in luminance of a point on the monitor over time) are shown above the SDFs or spike traces. Shaded regions on the SDFs in (B) and (C) indicate SEM. (D) Scatter graphs showing recording depths for VGAT (blue) and PvAi32 (red) transgenic mice. Approximate layer boundaries are indicated on the right vertical axis (Lein et al., 2007). Histograms indicating cell count distribution across approximate cortical layers are shown inset.
Figure 2
Figure 2
Optogenetic modulation of V1 orientation tuning curves. (A–H) Orientation tuning curves from putative V1 pyramidal neurons recorded in VGAT (blue) and PvAi32 (red) transgenic mice. Solid and empty circles show mean firing rates for the control and photostimulated conditions, respectively. Smooth curves show double von Mises fits to control (solid lines) and photostimulation data (dotted lines). Error bars indicate SEM. The orientation selectivity indexes for control (OSIctrl) and photostimulated (OSIled) conditions are noted inset.
Figure 3
Figure 3
Population data obtained from double von Mises fits. The left column (blue symbols) shows data from VGAT mice, and the right column (red symbols) shows data from PvAi32 mice. (A,C) Scatter plots comparing peak firing (A1) in the control (ctrl.; abscissa) and photostimulated (opto.; ordinate) conditions. (B,D) Scatter plots in a similar format comparing baseline firing (B) in the ctrl. and opto. conditions. (E,F) Scatter plots comparing the proportional change in peak (abscissa) and baseline firing (ordinate). Note that photostimulation consistently produced larger drops in peak firing relative to baseline firing. (G,H) Scatter plots comparing the direction selectivity index (DSI) calculated in the control (abscissa) and photostimulated (ordinate) conditions. (I,J) Scatter plots comparing the preferred direction (ϕ) of the primary (filled circles) and secondary (empty circles) peaks in the control (abscissa) and photostimulated (ordinate) conditions. Inset scatter plots show the peak-to-peak distance (Δϕ) for control (abscissa) and photostimulated (ordinate) conditions.
Figure 4
Figure 4
Correlating optogenetically induced suppression with tuning curve changes. Blue symbols show data from VGAT mice and red symbols show data from PvAi32 mice. (A) Scatter column graphs comparing the proportional decrease in firing for VGAT and PvAi32 mice. (B) Scatter column graphs in a similar format to (A), but the proportional drop in firing was normalized by photostimulation irradiance. The population medians are shown as horizontal lines in (A) and (B), and significant (*) and non-significant statistical comparisons (n.s.) are indicated. (C,D) Scatter plots correlating the proportional decrease in firing induced by photostimulation (abscissa) with the change in tuning breadth (ΔHWHH; ordinate). (E,F) Scatter plots correlating the proportional decrease in firing (abscissa) with the change in direction selectivity index (ΔDSI; ordinate). (G,H) Scatter plots correlating the proportional decrease in firing (abscissa) with the change in orientation selectivity index (ΔOSI; ordinate). All correlation scatter plots (CH) show the linear regression (solid line), the 95% confidence intervals for the regression (dotted lines), the correlation coefficient (r; top row inset) and p-value (bottom row inset).
Figure 5
Figure 5
Divisive and subtractive model fits to tuning curves. The left column (blue symbols) shows data from VGAT mice, and the right column (red symbols) shows data from PvAi32 mice. (A–F) Orientation tuning curves from putative V1 pyramidal neurons. As in Figure 1, solid and empty circles show mean firing rates for the control and photostimulated conditions, respectively. Control data was fit with double von Mises curves, as shown with smooth blue and red lines in VGAT and PvAi32 transgenic mice, respectively. For each neuron, photostimulated data points were fitted with models that either divisively scaled (cyan curves) or subtractively shifted (magenta curves) the control curve. (G,H) Scatter plots comparing the sum of squared errors (SS) for the divisive (Div.; abscissa) and subtractive (Sub.; ordinate) model fits to the photostimulated data. Note that the sum of squared errors for the subtractive model were consistently larger than for the divisive model indicating the divisive model provided better fits.

References

    1. Anderson J. S., Carandini M., Ferster D. (2000). Orientation tuning of input conductance, excitation, and inhibition in cat primary visual cortex. J. Neurophysiol. 84, 909–926. 10.1152/jn.2000.84.2.909 - DOI - PubMed
    1. Asrican B., Augustine G. J., Berglund K., Chen S., Chow N., Deisseroth K., et al. . (2013). Next-generation transgenic mice for optogenetic analysis of neural circuits. Front. Neural Circuits. 7:160. 10.3389/fncir.2013.00160 - DOI - PMC - PubMed
    1. Atallah B. V., Bruns W., Carandini M., Scanziani M. (2012). Parvalbumin-expressing interneurons linearly transform cortical responses to visual stimuli. Neuron 73, 159–170. 10.1016/j.neuron.2011.12.013 - DOI - PMC - PubMed
    1. Atallah B. V., Scanziani M., Carandini M. (2014). Atallah et al. reply. Nature 508:E3. 10.1038/nature13129 - DOI - PubMed
    1. Ayzenshtat I., Karnani M. M., Jackson J., Yuste R. (2016). Cortical control of spatial resolution by VIP + interneurons. J. Neurosci. 36, 11498–11509. 10.1523/JNEUROSCI.1920-16.2016 - DOI - PMC - PubMed

Publication types

LinkOut - more resources