

Evaluation of Enhanced Learning Techniques for Segmenting Ischaemic Stroke Lesions in Brain Magnetic Resonance Perfusion Images Using a Convolutional Neural Network Scheme
- PMID: 31191282
- PMCID: PMC6548861
- DOI: 10.3389/fninf.2019.00033
Evaluation of Enhanced Learning Techniques for Segmenting Ischaemic Stroke Lesions in Brain Magnetic Resonance Perfusion Images Using a Convolutional Neural Network Scheme
Abstract
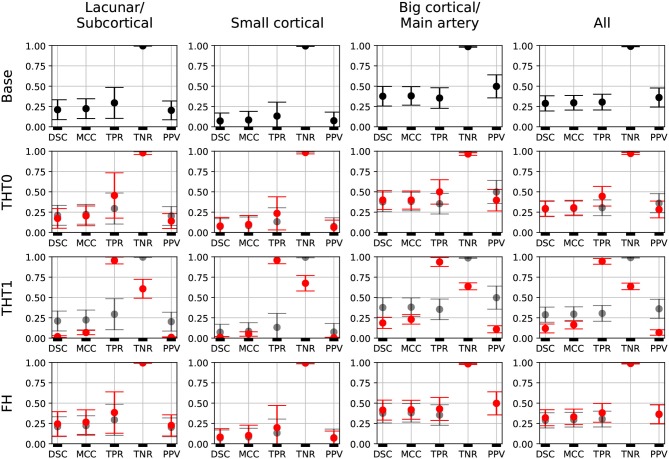
Magnetic resonance (MR) perfusion imaging non-invasively measures cerebral perfusion, which describes the blood's passage through the brain's vascular network. Therefore, it is widely used to assess cerebral ischaemia. Convolutional Neural Networks (CNN) constitute the state-of-the-art method in automatic pattern recognition and hence, in segmentation tasks. But none of the CNN architectures developed to date have achieved high accuracy when segmenting ischaemic stroke lesions, being the main reasons their heterogeneity in location, shape, size, image intensity and texture, especially in this imaging modality. We use a freely available CNN framework, developed for MR imaging lesion segmentation, as core algorithm to evaluate the impact of enhanced machine learning techniques, namely data augmentation, transfer learning and post-processing, in the segmentation of stroke lesions using the ISLES 2017 dataset, which contains expert annotated diffusion-weighted perfusion and diffusion brain MRI of 43 stroke patients. Of all the techniques evaluated, data augmentation with binary closing achieved the best results, improving the mean Dice score in 17% over the baseline model. Consistent with previous works, better performance was obtained in the presence of large lesions.
Keywords: computer vision; convolutional neural networks; deep learning; deepmedic; ischaemic stroke; medical image analysis; segmentation.
Figures


Similar articles
-
Combined Transfer Learning and Test-Time Augmentation Improves Convolutional Neural Network-Based Semantic Segmentation of Prostate Cancer from Multi-Parametric MR Images.Comput Methods Programs Biomed. 2021 Oct;210:106375. doi: 10.1016/j.cmpb.2021.106375. Epub 2021 Aug 28. Comput Methods Programs Biomed. 2021. PMID: 34500139
-
Segmentation of white matter hyperintensities using convolutional neural networks with global spatial information in routine clinical brain MRI with none or mild vascular pathology.Comput Med Imaging Graph. 2018 Jun;66:28-43. doi: 10.1016/j.compmedimag.2018.02.002. Epub 2018 Feb 17. Comput Med Imaging Graph. 2018. PMID: 29523002
-
Acute and sub-acute stroke lesion segmentation from multimodal MRI.Comput Methods Programs Biomed. 2020 Oct;194:105521. doi: 10.1016/j.cmpb.2020.105521. Epub 2020 May 6. Comput Methods Programs Biomed. 2020. PMID: 32434099
-
Deep convolutional neural networks for brain image analysis on magnetic resonance imaging: a review.Artif Intell Med. 2019 Apr;95:64-81. doi: 10.1016/j.artmed.2018.08.008. Epub 2018 Sep 6. Artif Intell Med. 2019. PMID: 30195984 Review.
-
Neuroimaging and deep learning for brain stroke detection - A review of recent advancements and future prospects.Comput Methods Programs Biomed. 2020 Dec;197:105728. doi: 10.1016/j.cmpb.2020.105728. Epub 2020 Aug 26. Comput Methods Programs Biomed. 2020. PMID: 32882591 Review.
Cited by
-
Distinct brain morphometry patterns revealed by deep learning improve prediction of post-stroke aphasia severity.Commun Med (Lond). 2024 Jun 12;4(1):115. doi: 10.1038/s43856-024-00541-8. Commun Med (Lond). 2024. PMID: 38866977 Free PMC article.
-
Brain tumor segmentation using 3D Mask R-CNN for dynamic susceptibility contrast enhanced perfusion imaging.Phys Med Biol. 2020 Sep 18;65(18):185009. doi: 10.1088/1361-6560/aba6d4. Phys Med Biol. 2020. PMID: 32674075 Free PMC article.
-
Exploring the potential of machine learning and magnetic resonance imaging in early stroke diagnosis: a bibliometric analysis (2004-2023).Front Neurol. 2025 Mar 14;16:1505533. doi: 10.3389/fneur.2025.1505533. eCollection 2025. Front Neurol. 2025. PMID: 40162012 Free PMC article.
-
Toward automated segmentation for acute ischemic stroke using non-contrast computed tomography.Int J Comput Assist Radiol Surg. 2022 Apr;17(4):661-671. doi: 10.1007/s11548-022-02570-x. Epub 2022 Mar 7. Int J Comput Assist Radiol Surg. 2022. PMID: 35257285
-
Performance of Machine Learning for Tissue Outcome Prediction in Acute Ischemic Stroke: A Systematic Review and Meta-Analysis.Front Neurol. 2022 Jul 8;13:910259. doi: 10.3389/fneur.2022.910259. eCollection 2022. Front Neurol. 2022. PMID: 35873778 Free PMC article.
References
-
- Aytar Y., Zisserman A. (2011). Tabula rasa: model transfer for object category detection, in 2011 IEEE International Conference on Computer Vision (ICCV) (Barcelona: IEEE; ), 2252–2259. 10.1109/ICCV.2011.6126504 - DOI
-
- Berger L., Hyde E., Cardoso J., Ourselin S. (2017). An adaptive sampling scheme to efficiently train fully convolutional networks for semantic segmentation. arXiv preprint arXiv:1709.02764. 10.1007/978-3-319-95921-4-26 - DOI
-
- Bland J. M., Altman D. G. (1986). Statistical methods for assessing agreement between two methods of clinical measurement. Lancet 1, 307–310. - PubMed
-
- Bowles C., Chen L., Guerrero R., Bentley P., Gunn R., Hammers A., et al. (2018). Gan augmentation: augmenting training data using generative adversarial networks. arXiv preprint arXiv:1810.10863.
LinkOut - more resources
Full Text Sources
Other Literature Sources