. 2019 May 22:11:17.
doi: 10.3389/fnsyn.2019.00017. eCollection 2019.

Mechanisms of PTPσ-Mediated Presynaptic Differentiation

Affiliations

Mechanisms of PTPσ-Mediated Presynaptic Differentiation

Claire Bomkamp et al. Front Synaptic Neurosci. .

Abstract

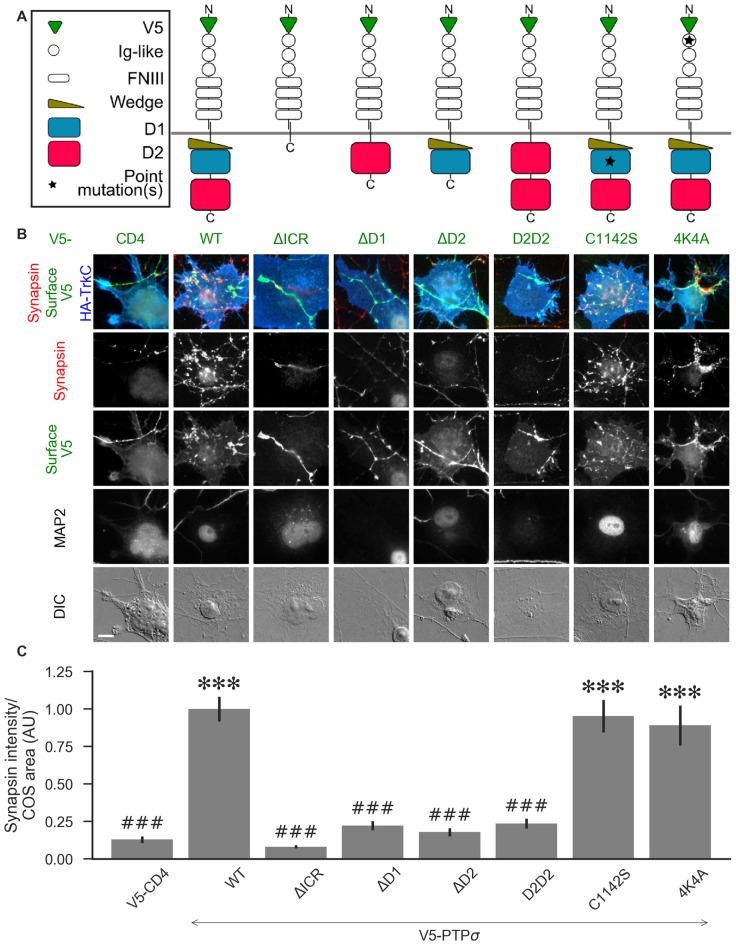
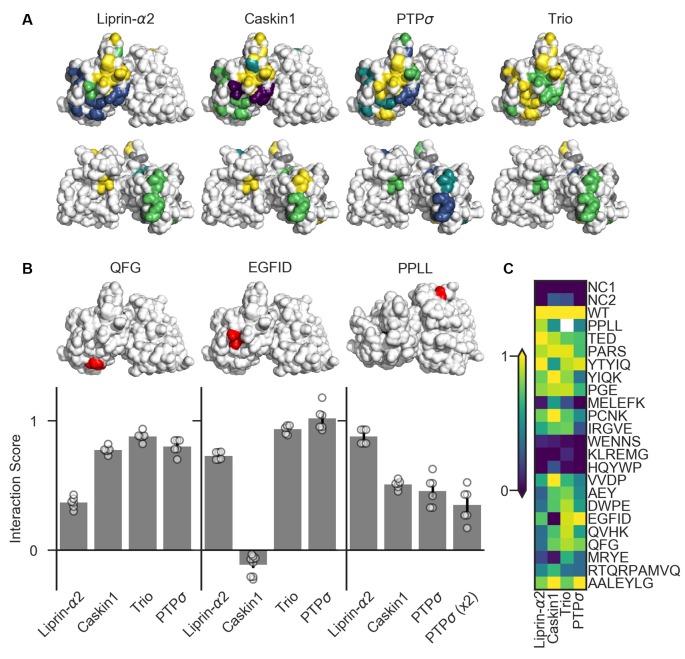
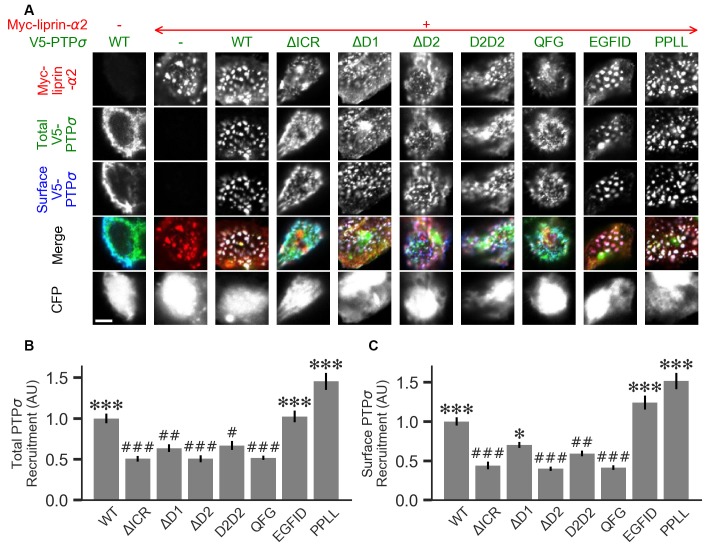
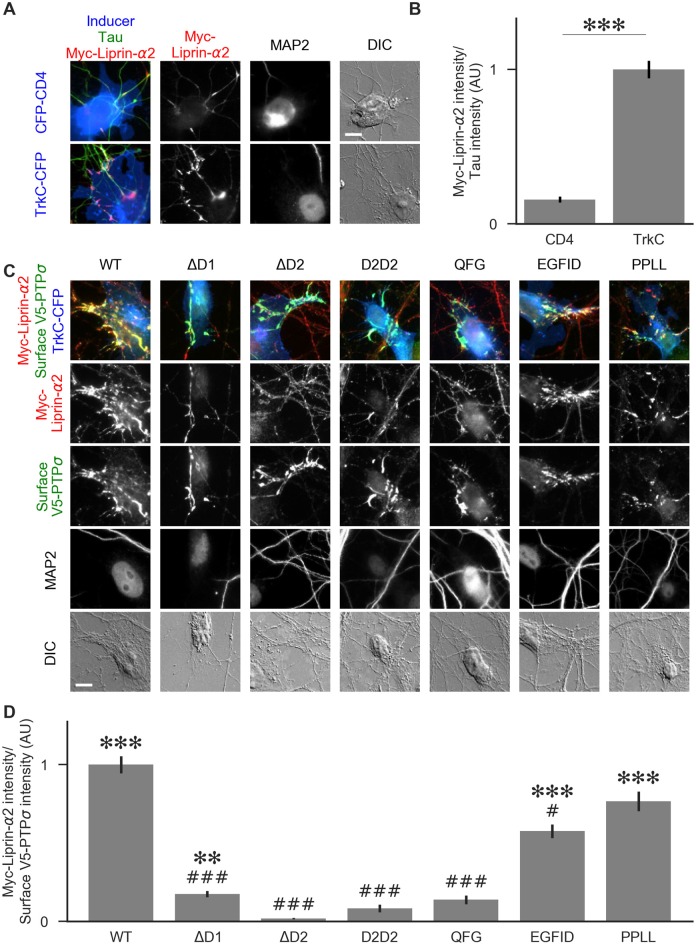
Formation of synapses between neurons depends in part on binding between axonal and dendritic cell surface synaptic organizing proteins, which recruit components of the developing presynaptic and postsynaptic specializations. One of these presynaptic organizing molecules is protein tyrosine phosphatase σ (PTPσ). Although the protein domains involved in adhesion between PTPσ and its postsynaptic binding partners are known, the mechanisms by which it signals into the presynaptic neuron to recruit synaptic vesicles and other necessary components for regulated transmitter release are not well understood. One attractive candidate to mediate this function is liprin-α, a scaffolding protein with well-established roles at the synapse. We systematically mutated residues of the PTPσ intracellular region (ICR) and used the yeast dihydrofolate reductase (DHFR) protein complementation assay to screen for disrupted interactions between these mutant forms of PTPσ and its various binding partners. Using a molecular replacement strategy, we show that disrupting the interaction between PTPσ and liprin-α, but not between PTPσ and itself or another binding partner, caskin, abolishes presynaptic differentiation. Furthermore, phosphatase activity of PTPσ and binding to extracellular heparan sulfate (HS) proteoglycans are dispensable for presynaptic induction. Previous reports have suggested that binding between PTPσ and liprin-α is mediated by the PTPσ membrane-distal phosphatase-like domain. However, we provide evidence here that both of the PTPσ phosphatase-like domains mediate binding to liprin-α and are required for PTPσ-mediated presynaptic differentiation. These findings further our understanding of the mechanistic basis by which PTPσ acts as a presynaptic organizer.

Keywords: LAR-RPTP; adhesion proteins; liprin; phosphatase; scaffolding proteins; synapse; synaptogenesis.


Figures

Figure 1
Figure 1
Knockdown confirmation and morphological characterization of neurons with reduced levels of LAR-RPTPs. (A) Quantification of mRNA levels for the three LAR-RPTPs, as well as glyceraldehyde-3-phosphate dehydrogenase (GAPDH) and β-actin as control reference genes, measured by RT-qPCR in hippocampal neurons treated with AAV shPTP relative to shCtrl. *p < 0.0001 vs. GAPDH, ANOVA with post hoc Dunnett’s multiple comparison test, n = 3 biological and three technical replicates each from two independent cultures (each point represents one biological replicate). AAVs were applied at DIV 6, and neurons were harvested at DIV 16. (B) Western blot against protein tyrosine phosphatase σ (PTPσ) in hippocampal neurons treated with either shCtrl or shPTP. AAVs were applied at DIV 6, and neurons were harvested at DIV 16. The full-size blot is shown in Supplementary Figure S1. (C) Example images of hippocampal neurons electroporated with either V5-CD4 or V5-PTPσ (columns) and treated at DIV 6 with AAVs carrying either shCtrl or shPTP sequences (rows). Neurons were fixed at DIV 14, stained for Tau (axons), MAP2 (dendrites), and DAPI (nuclei), and imaged. Scale bar represents 200 μm. (D) Quantification of total MAP2-positive area per field, normalized to the number of DAPI-stained nuclei in the field. Overall p-value for the experiment was 0.00157, Kruskal-Wallis, n = 160–161 fields per condition from four independent cultures. n.s., not significant, p > 0.05 by Dunn’s post hoc test. (E) Quantification of total Tau-positive area per field, normalized to the number of DAPI-stained nuclei in the same field. Overall p-value for the experiment was 2.021 × 10−36, Kruskal-Wallis. ***p < 0.001, Dunn’s post hoc test, n.s., not significant. (F) Quantification of the ratio between Tau and MAP2 total area per field. Overall p-value for the experiment was 1.578 × 10−36, Kruskal-Wallis. ***p < 0.001, Dunn’s post hoc test, n.s., not significant.
Figure 2
Figure 2
Synaptogenic activity of TrkC is abolished by LAR-RPTP triple knockdown and rescued by PTPσ. (A) Representative images of HA-TrkC cocultures in which neurons were treated with either control (shCtrl) or LAR-RPTP triple knockdown (shPTP)-expressing AAVs, and rescued using V5-CD4 as a control or RNAi-resistant V5-PTPσ. Left-most column shows neurons cocultured with COS cells expressing HA-CD4 as a negative control. Rescue constructs were introduced by nucleofection at DIV 0, AAV shRNAs were applied at DIV 6, and coculture assays were performed at DIV 13–14. Synapsin was recruited in tau-positive axons at sites of contact with TrkC-expressing (but not CD4-expressing) COS cells. Microtubule-associated protein 2 (MAP2) labeling of dendrites was used to exclude native synapses from analysis. Scale bar represents 10 μm. (B–D) Quantification of synapsin recruitment, contact area between tau-positive axons and transfected COS cells, and intensity of HA-CD4 or HA-TrkC on the COS cell surface, from the experiment shown in (A). “Contact area” is defined as the region where axons contact the inducer-expressing COS cell, excluding the area overlapped by MAP2-positive dendrites. “COS area” also excludes areas of MAP2 overlap. Values are normalized to the mean value in the shCtrl + CD4 with TrkC coculture condition from the same culture. Data are expressed as mean ± SEM. Overall p-values were 5.05 × 10⁻²⁰ (B), 4.02 × 10⁻¹⁹ (C), and 0.66 (D), Kruskal-Wallis, n = 28–32 cells per condition from three independent cultures. ***p < 0.001, **p < 0.01 compared to shCtrl + CD4 with CD4 coculture, ###p < 0.001 compared to shCtrl + CD4 with TrkC coculture, Dunn’s post hoc test, n. s., not significant.
Figure 3
Figure 3
Synaptogenic activity of NGL-3 is abolished by LAR-RPTP triple knockdown and rescued by PTPσ. (A) Representative images of HA-NGL-3 cocultures in which neurons were treated with either control (shCtrl) or LAR-RPTP triple knockdown (shPTP)-expressing AAVs, and rescued using V5-CD4 as a control or RNAi-resistant V5-PTPσ. Rescue constructs were introduced by nucleofection at DIV 0, AAV shRNAs were applied at DIV 6, and coculture assays were performed at DIV 13–14. Synapsin was recruited in tau-positive axons at sites of contact with NGL-3-expressing COS cells. MAP2 labeling of dendrites was used to exclude native synapses from analysis. Scale bar represents 10 μm. (B–D) Quantification of synapsin recruitment, contact area between tau-positive axons and transfected COS cells, and intensity of HA-CD4 or HA-NGL-3 on the COS cell surface, from the experiment shown in (A). “Contact area” is defined as the region where axons contact the inducer-expressing COS cell, excluding the area overlapped by MAP2-positive dendrites. “COS area” also excludes areas of MAP2 overlap. Values are normalized to the mean value in the shCtrl + CD4 with TrkC coculture condition from the same culture. Data are expressed as mean ± SEM. Overall p-values were 6.69 × 10⁻¹³ (B), 4.07 × 10⁻¹³ (C), and 0.034 (D, although none of the individual comparisons were significant based on Dunn’s post hoc test), Kruskal-Wallis, n = 27–31 cells per condition from three independent cultures. ***p < 0.001 compared to shCtrl + CD4 with CD4 coculture, ###p < 0.001 compared to shCtrl + CD4 with NGL-3 coculture, Dunn’s post hoc test. CD4 coculture condition is the same as that shown in Figure 2 (see Figure 2A for example image), n. s., not significant.
Figure 4
Figure 4
Synaptogenic activity of neuroligin-2 (NL2) is unaffected by LAR-RPTP triple knockdown or expression of PTPσ. (A) Representative images of HA-NL2 cocultures in which neurons were treated with either control (shCtrl) or LAR-RPTP triple knockdown (shPTP)-expressing AAVs, and rescued using V5-CD4 as a control or RNAi-resistant V5-PTPσ. Rescue constructs were introduced by nucleofection at DIV 0, AAV shRNAs were applied at DIV 6, and coculture assays were performed at DIV 13–14. Synapsin was recruited in tau-positive axons at sites of contact with NL2-expressing COS cells. MAP2 labeling of dendrites was used to exclude native synapses from analysis. Scale bar represents 10 μm. (B–D) Quantification of synapsin recruitment, contact area between tau-positive axons and transfected COS cells, and intensity of HA-CD4 or HA-NL2 on the COS cell surface, from the experiment shown in (A). “Contact area” is defined as the region where axons contact the inducer-expressing COS cell, excluding the area overlapped by MAP2-positive dendrites. “COS area” also excludes areas of MAP2 overlap. Values are normalized to the mean value in the shCtrl + CD4 with TrkC coculture condition from the same culture. Data are expressed as mean ± SEM. Overall p-values were 4.70 × 10⁻¹⁵ (B), 2.44 × 10⁻¹³ (C), and 0.40 (D), Kruskal-Wallis, n = 26–32 cells per condition from three independent cultures. ***p < 0.001, **p < 0.01 compared to shCtrl + CD4 with CD4 coculture, ###p < 0.001, ##p < 0.01 compared to shCtrl + CD4 with NL2 coculture, Dunn’s post hoc test. CD4 coculture condition is the same as that shown in Figure 2 (see Figure 2A for example image), n. s., not significant.
Figure 5
Figure 5
PTPσ requires its D1 and D2 domains, but not its phosphatase activity or heparan sulfate (HS)-binding, to mediate TrkC synaptogenic activity. (A) Schematic view of PTPσ mutants used in this experiment. Each schematic corresponds to the label and column of images directly below it in (B). (B) Representative images of HA-TrkC cocultures where neurons were treated with shPTP-expressing AAVs, and rescued using V5-CD4 as a control or RNAi-resistant V5-PTPσ carrying the indicated mutations. Rescue constructs were introduced by nucleofection at DIV 0, AAV shRNAs were applied at DIV 6, and coculture assays were performed at DIV 13–14. MAP2 labeling of dendrites was used to exclude native synapses from analysis. Scale bar represents 10 μm. (C) Quantification of synapsin recruitment shown in (B). “COS area” indicates only the portion of the TrkC-expressing COS cell not overlapping with MAP2 signal. All values are normalized to the mean of the wild-type (WT) condition from the same culture. Data are expressed as mean ± SEM. Overall p-value for this experiment was 1.32 × 10−44, Kruskal-Wallis, n = 33–100 cells per condition from 2–3 cultures. ***p < 0.001 compared to CD4, ###p < 0.001 compared to WT, Dunn’s post hoc test. There were no differences in surface levels of the V5-PTPσ mutants (Supplementary Figure S2A).
Figure 6
Figure 6
Identification of PTPσ mutations to disrupt specific interactions. (A) Interaction scores for each ligand in the dihydrofolate reductase (DHFR) protein complementation assay mapped onto the PTPσ crystal structure (Hou et al., 2011). Interaction scores are divided into five bins and colored accordingly: <0.2 purple; 0.2–0.4 blue; 0.4–0.6 teal; 0.6–0.8 green; >0.8 yellow. Mutants which showed an interaction score <0.3 for at least three ligands are shown in gray. Top row shows the D1 domain on the right and D2 on the left. Second row shows the same structures, flipped horizontally. (B) Quantification of mutants that were used in subsequent experiments. Models above each plot are the same crystal structures as shown in the top row in (A), with the indicated mutation shown in red. The model for PPLL is rotated forward slightly relative to the others in order to make these residues visible. Note that horizontal axis is different for PPLL since this mutation was not tested for interaction with trio, and since in the case of PTPσ homodimerization we also tested the condition where both copies of PTPσ carried the mutation [PTPσ (x2)]. Data are mean ± SEM. (C) Heatmap showing interaction scores for 22 different PTPσ multi-point mutations. NC1 indicates the negative control where the DHFR C-terminal fragment was fused to YFP or NgCAM instead of the indicated ligand; NC2 indicates the negative control where the DHFR N-terminal fragment was fused to NgCAM or YFP instead of to PTPσ. Interaction scores represent the growth rate of the indicated strain in MTX-containing media relative to MTX-free media and relative to controls, with 0 indicating the same relative growth rate as NC1 and one indicating the same relative growth rate as WT PTPσ. Values higher than 1 or lower than 0 are clipped to 1 and 0. White indicates no data (residues affected by the PPLL mutation are not present in the fragment of PTPσ used to test interaction with trio). Data are based on two experiments per condition and three replicates per experiment.
Figure 7
Figure 7
Measurement of PTPσ/liprin-α2 interaction based on co-clustering in HEK cells. (A) Representative images of HEK cells transfected with myc-liprin-α2, V5-PTPσ WT or mutant, and CFP. Scale bar represents 5 μm. (B) Quantification of the extent to which PTPσ was recruited to sites of liprin-α clustering. “Total PTPσ Recruitment” refers to the ratio between the intensity of V5-PTPσ colocalized with myc-liprin-α2 puncta vs. the remaining area of the cell, normalized to the mean value for cells in the WT condition from the same culture. Overall p-value was 7.5 × 10⁻²³, Kruskal-Wallis. *p < 0.05, ***p < 0.001 compared to WT, #p < 0.05, ##p < 0.01, ###p < 0.001 compared to intracellular region (ΔICR), Dunn’s post hoc test. (C) Same as (B), but using surface stained V5-PTPσ rather than total. Overall p-value was 2.3 × 10⁻³¹, Kruskal-Wallis. *p < 0.05, ***p < 0.001 compared to WT, #p < 0.05, ##p < 0.01, ###p < 0.001 intracellular region (ΔICR), Dunn’s post hoc test.
Figure 8
Figure 8
Recruitment of liprin-α2 by TrkC coculture in the presence of PTPσ mutants. (A) Representative images of cocultures with either CFP-CD4 or TrkC-CFP in which neurons were transfected with and stained for myc-liprin-α2. Transfections were performed at DIV 0 and coculture assays were performed at DIV 13–14. The transfected protein was recruited by COS cells expressing TrkC but not by those expressing CD4. MAP2 labeling of dendrites was used to exclude native synapses from analysis. Scale bar represents 10 μm. (B) Quantification of recruitment shown in (A). Measurement was performed on the contact area only, defined as the region where axons contact the inducer-expressing COS cell, excluding the area overlapped by MAP2-positive dendrites. Values are normalized to the mean value of recruitment by TrkC from the same culture. Data are mean ± SEM. ***p < 0.001, Mann-Whitney, n = 96 cells per condition from three independent cultures. (C) Representative images of neurons co-transfected with myc-liprin-α2 and V5-PTPσ WT or mutant, treated with shPTP-expressing AAVs at DIV 6, and cocultured with COS cells expressing TrkC. Scale bar represents 10 μm. (D) Quantification of the extent of myc-liprin-α2 recruitment relative to V5-PTPσ recruitment as shown in (C). There were no differences in surface levels of the V5-PTPσ mutants in the areas assayed (Supplementary Figure S2E). Measurements were limited to the area of the COS cell which lacked MAP2 signal. All values are normalized to the mean of the WT condition from the same culture. Data are expressed as mean ± SEM. Overall p-value for this experiment was 3.43 × 10–39, Kruskal-Wallis, n = 20–50 cells per condition from two cultures. ***p < 0.001, ***p < 0.01 compared to ΔD2; ###p < 0.001, #p < 0.05 compared to WT, Dunn’s post hoc test.
Figure 9
Figure 9
The liprin-α2 binding site, but not the caskin1 binding site or homodimerization site, of PTPσ is required for TrkC synaptogenic activity. (A) Representative images of HA-TrkC cocultures where neurons were treated with shPTP-expressing AAVs, and rescued using RNAi-resistant V5-PTPσ carrying the indicated mutations. Rescue constructs were introduced by nucleofection at DIV 0, AAV shRNAs were applied at DIV 6, and coculture assays were performed at DIV 13–14. The V5-PTPσ constructs were recruited by TrkC-expressing COS cells, in some cases inducing local clustering of synapsin. MAP2 labeling of dendrites was used to exclude native synapses from analysis. The QFG, EGFID, and PPLL mutations were shown to primarily disrupt binding of PTPσ to liprin-α2, caskin1 and to itself, respectively (see Figures 6, 7). Scale bar represents 10 μm. (B) Quantification of induced synapsin clustering in (A). There were no differences in surface levels of the V5-PTPσ mutants (Supplementary Figure S2F). Measurements were limited to the area of the COS cell which lacked MAP2 signal. All values are normalized to the mean of the WT condition from the same culture. Data are expressed as mean ± SEM. Overall p-value for this experiment was 9.86 × 10⁻³¹, Kruskal-Wallis, n = 34–71 cells per condition from three cultures. ***p < 0.001 compared to ΔICR, ###p < 0.001 compared to WT, Dunn’s post hoc test.

Similar articles

Cited by

References

    1. Ackley B. D., Harrington R. J., Hudson M. L., Williams L., Kenyon C. J., Chisholm A. D., et al. . (2005). The two isoforms of the Caenorhabditis elegans leukocyte-common antigen related receptor tyrosine phosphatase PTP-3 function independently in axon guidance and synapse formation. J. Neurosci. 25, 7517–7528. 10.1523/JNEUROSCI.2010-05.2005 - DOI - PMC - PubMed
    1. Aricescu A. R., McKinnell I. W., Halfter W., Stoker A. W. (2002). Heparan sulfate proteoglycans are ligands for receptor protein tyrosine phosphatase σ. Mol. Cell. Biol. 22, 1881–1892. 10.1128/mcb.22.6.1881-1892.2002 - DOI - PMC - PubMed
    1. Astigarraga S., Hofmeyer K., Farajian R., Treisman J. E. (2010). Three Drosophila liprins interact to control synapse formation. J. Neurosci. 30, 15358–15368. 10.1523/JNEUROSCI.1862-10.2010 - DOI - PMC - PubMed
    1. Boussif O., Lezoualc’h F., Zanta M. A., Mergny M. D., Scherman D., Demeneix B., et al. . (1995). A versatile vector for gene and oligonucleotide transfer into cells in culture and in vivo: polyethylenimine. Proc. Natl. Acad. Sci. U S A 92, 7297–7301. 10.1073/pnas.92.16.7297 - DOI - PMC - PubMed
    1. Chagnon M. J., Uetani N., Tremblay M. L. (2004). Functional significance of the LAR receptor protein tyrosine phosphatase family in development and diseases. Biochem. Cell Biol. 82, 664–675. 10.1139/o04-120 - DOI - PubMed