

Combination of G-CSF and AMD3100 Improves the Anti-inflammatory Effect of Mesenchymal Stem Cells on Inducing M2 Polarization of Macrophages Through NF-κB-IL1RA Signaling Pathway
- PMID: 31191315
- PMCID: PMC6546872
- DOI: 10.3389/fphar.2019.00579
Combination of G-CSF and AMD3100 Improves the Anti-inflammatory Effect of Mesenchymal Stem Cells on Inducing M2 Polarization of Macrophages Through NF-κB-IL1RA Signaling Pathway
Abstract
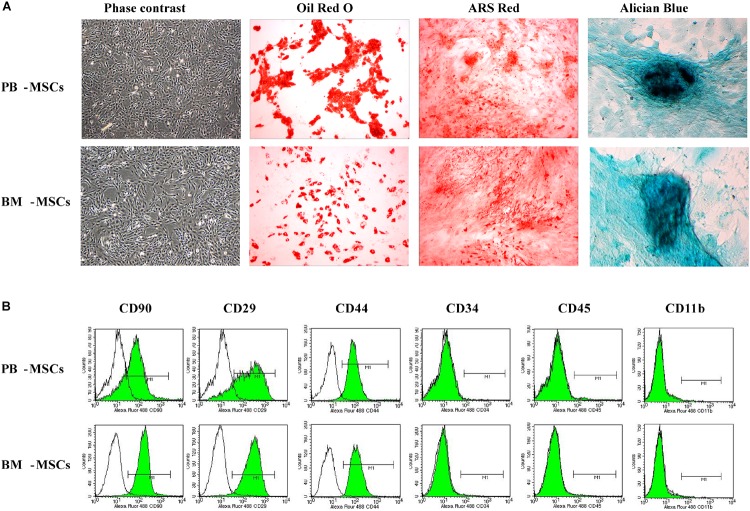
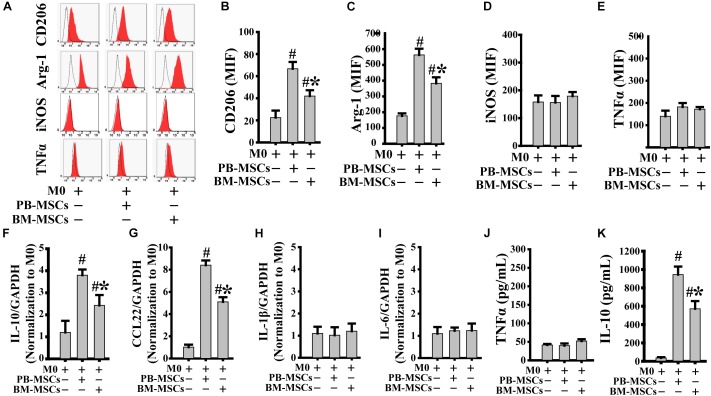
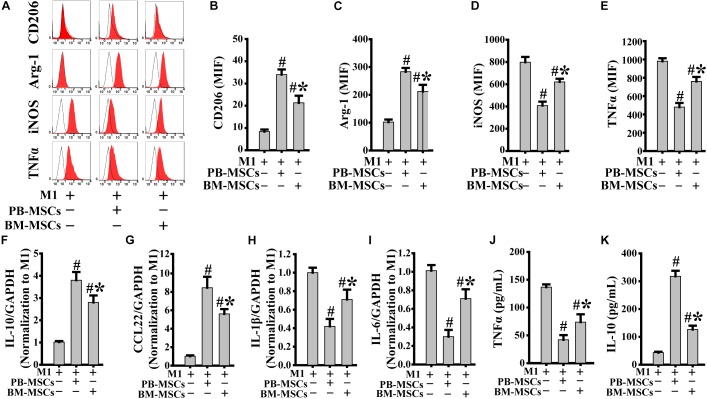
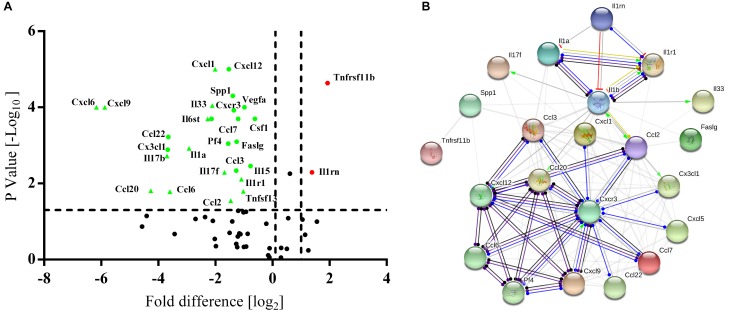
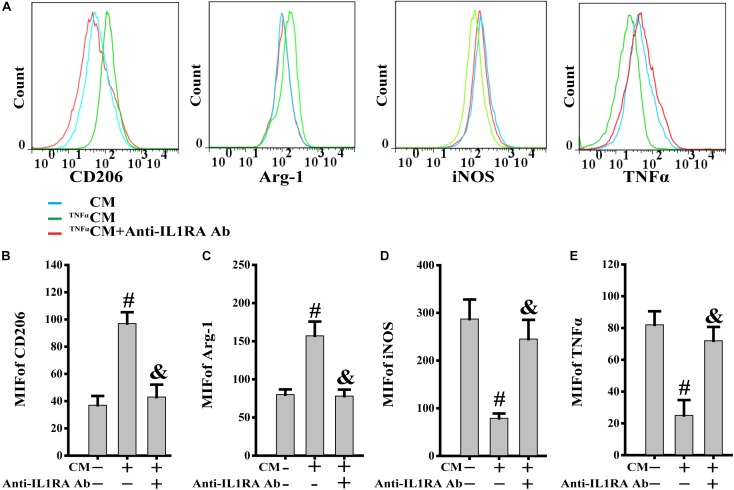
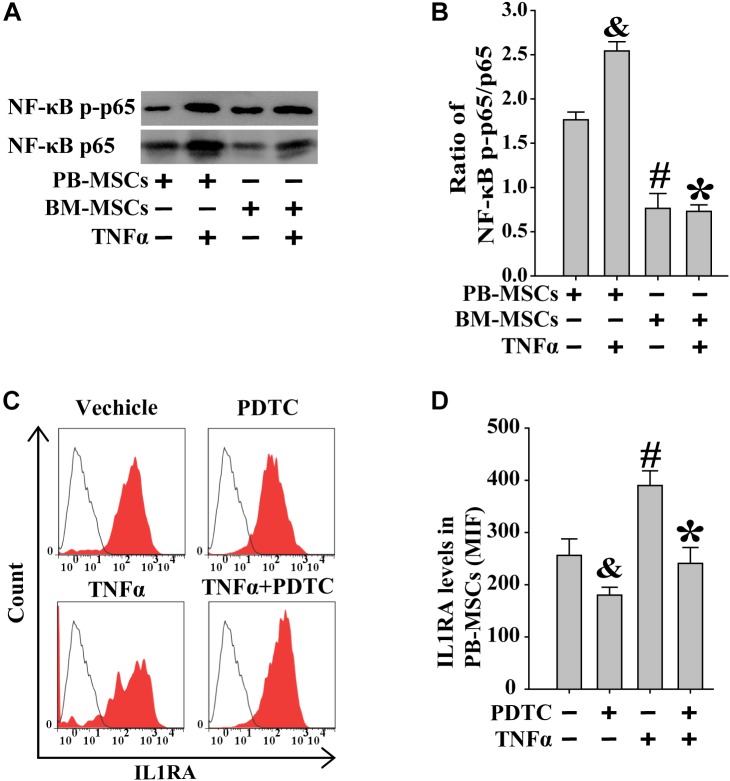
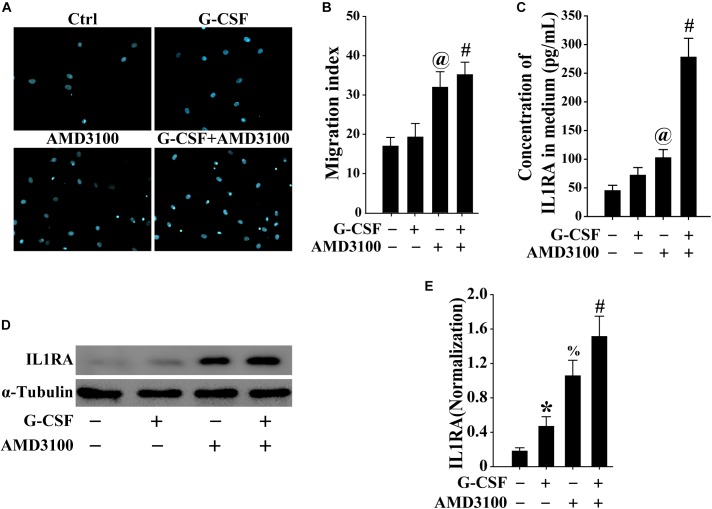
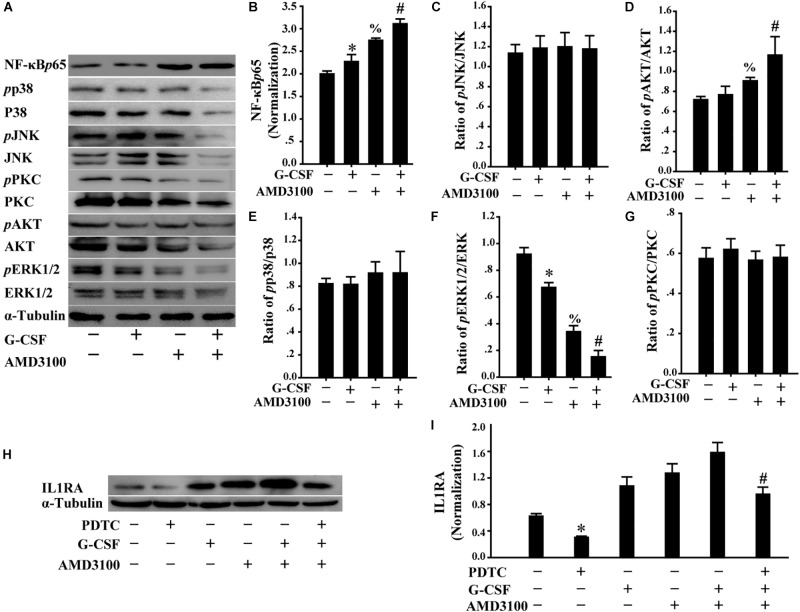
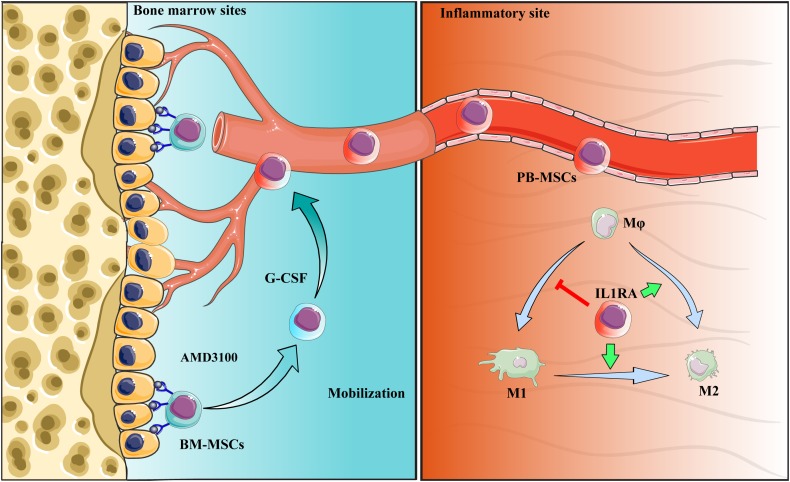
Mobilized peripheral blood-derived mesenchymal stem cells (PB-MSCs) mainly derived from bone marrow-derived MSCs (BM-MSCs) exert a similar anti-inflammatory effect. However, the mechanism of anti-inflammatory effect of mobilized PB-MSCs by a combination of G-CSF and AMD3100 remains unclear. Cultured rat PB-MSCs mobilized by G-CSF/AMD3100 have shown typical surface markers and potential for multiple differentiations, similar to non-mobilized BM-MSCs. In a co-culture system, rat M0-type macrophages co-cultured with PB-MSCs have shown higher expression of M2 markers including CD206, Arg-1, IL-10, and CCL-22 than BM-MSCs, indicating that PB-MSCs induced greater M0 polarization to M2. Furthermore, compared with BM-MSCs, PB-MSCs in a co-culture system with lipopolysaccharide-induced M1-type macrophages more efficiently promoted M1 polarization to M2, accompanied by increasing expression of CD206, Arg-1, IL-10, and CCL-22 while decreasing expression of M1 markers including iNOS, TNF-α, IL-1β and IL-6, indicating that PB-MSCs triggered greater M1 polarization to M2. Subsequently, polymerase chain reaction arrays showed higher expressions of both IL1rn and Tnfrsf11b in PB-MSCs versus BM-MSCs. In response to an inflammatory niche, such as TNF-α, PB-MSCs have shown higher expression and release of IL1RA, causing greater M2 polarization of macrophages, and the special effects may be almost entirely abolished through the neutralization antibody of IL1RA. Mechanistic studies determined that PB-MSCs showed higher levels NF-κBp65 and NF-κBp-p65 than BM-MSCs, which could be obviously enhanced by TNF-α. And the increased IL1RA expression by TNF-α in PB-MSCs could be markedly canceled by an NF-κB inhibitor PDTC. Interestingly, mimicking the mobilized PB-MSCs by a combination of G-CSF and AMD3100 in vivo, BM-MSCs were treated with G-CSF and/or AMD3100 in vitro, showing the increased expressions of NF-κBp65 and IL1RA, which could be prominently abolished by PDTC. Therefore, targeting IL1rn, gene modification or drug intervention for MSCs may provide a novel therapeutic strategy for human diseases, especially inflammatory diseases.
Keywords: IL1rn; NF-κB; anti-inflammatory; macrophage; peripheral blood-derived mesenchymal stem cells; polarization.
Figures
Similar articles
-
Enoxaparin sodium bone cement plays an anti-inflammatory immunomodulatory role by inducing the polarization of M2 macrophages.J Orthop Surg Res. 2023 May 23;18(1):380. doi: 10.1186/s13018-023-03865-8. J Orthop Surg Res. 2023. PMID: 37221568 Free PMC article.
-
Establishment of NF-κB sensing and interleukin-4 secreting mesenchymal stromal cells as an "on-demand" drug delivery system to modulate inflammation.Cytotherapy. 2017 Sep;19(9):1025-1034. doi: 10.1016/j.jcyt.2017.06.008. Epub 2017 Jul 21. Cytotherapy. 2017. PMID: 28739167 Free PMC article.
-
[Regulatory effect of bone marrow mesenchymal stem cells on polarization of macrophages].Zhonghua Gan Zang Bing Za Zhi. 2017 Apr 20;25(4):273-278. doi: 10.3760/cma.j.issn.1007-3418.2017.04.008. Zhonghua Gan Zang Bing Za Zhi. 2017. PMID: 28494546 Chinese.
-
Can a Conversation Between Mesenchymal Stromal Cells and Macrophages Solve the Crisis in the Inflamed Intestine?Front Pharmacol. 2018 Mar 6;9:179. doi: 10.3389/fphar.2018.00179. eCollection 2018. Front Pharmacol. 2018. PMID: 29559912 Free PMC article. Review.
-
The Crosstalk between Mesenchymal Stem Cells and Macrophages in Bone Regeneration: A Systematic Review.Stem Cells Int. 2021 Jun 14;2021:8835156. doi: 10.1155/2021/8835156. eCollection 2021. Stem Cells Int. 2021. PMID: 34221025 Free PMC article. Review.
Cited by
-
Graphene oxide-modified silk fibroin/nanohydroxyapatite scaffold loaded with urine-derived stem cells for immunomodulation and bone regeneration.Stem Cell Res Ther. 2021 Dec 4;12(1):591. doi: 10.1186/s13287-021-02634-w. Stem Cell Res Ther. 2021. PMID: 34863288 Free PMC article.
-
Peripheral Blood-Derived Mesenchymal Stem Cells Modulate Macrophage Plasticity through the IL-10/STAT3 Pathway.Stem Cells Int. 2022 Apr 11;2022:5181241. doi: 10.1155/2022/5181241. eCollection 2022. Stem Cells Int. 2022. PMID: 35450344 Free PMC article.
-
Endogenous stem cell mobilization and localized immunosuppression synergistically ameliorate DSS-induced Colitis in mice.Stem Cell Res Ther. 2024 Jun 13;15(1):167. doi: 10.1186/s13287-024-03777-2. Stem Cell Res Ther. 2024. PMID: 38872206 Free PMC article.
-
Dissecting the heterogeneity of the microenvironment in primary and recurrent nasopharyngeal carcinomas using single-cell RNA sequencing.Oncoimmunology. 2022 Jan 25;11(1):2026583. doi: 10.1080/2162402X.2022.2026583. eCollection 2022. Oncoimmunology. 2022. PMID: 35096485 Free PMC article.
-
CC Chemokine Family Members' Modulation as a Novel Approach for Treating Central Nervous System and Peripheral Nervous System Injury-A Review of Clinical and Experimental Findings.Int J Mol Sci. 2024 Mar 28;25(7):3788. doi: 10.3390/ijms25073788. Int J Mol Sci. 2024. PMID: 38612597 Free PMC article. Review.
References
-
- Dinarello C. A. (1996). Biologic basis for interleukin-1 in disease. Blood 87 2095–2147. - PubMed
LinkOut - more resources
Full Text Sources
Research Materials
Miscellaneous