. 2019 May 28:10:630.
doi: 10.3389/fphys.2019.00630. eCollection 2019.

Abnormalities in Glucose Metabolism, Appetite-Related Peptide Release, and Pro- i nflammatory Cytokines Play a Central Role in Appetite Disorders in Peritoneal Dialysis

Affiliations

Abnormalities in Glucose Metabolism, Appetite-Related Peptide Release, and Pro- i nflammatory Cytokines Play a Central Role in Appetite Disorders in Peritoneal Dialysis

Lorena Avila-Carrasco et al. Front Physiol. .

Abstract

Background: Appetite disorders are frequent and scantly studied in peritoneal dialysis (PD) patients and are associated with malnutrition and cardiovascular complications. Objective: We investigated the relationship between uremic insulin resistance, pro-inflammatory cytokines, and appetite-related peptides release (ARPr) with eating-behavior disorders in PD patients. Methods: We included 42 PD patients (12 suffering anorexia, 12 obese with high food-intake, and 18 asymptomatic) and 10 controls. We measured blood levels of ARPr including orexigens [neuropeptide-Y (NPY), ghrelin, and nitric-oxide], anorexigens [cholecystokinin, insulin, corticotropin-releasing factor, leptin, and adiponectin (Ad)], and cytokines (TNF-α, sTNFα-R2, and IL-6) both at baseline and after administering a standard-food stimulus (SFS). We also measured the expression of TNF-α, leptin and Ad-encoding mRNAs in abdominal adipose tissue. We compared these markers with eating motivation measured by a Visual Analog Scale (VAS). Results: Anorexics showed both little appetite, measured by a VAS, and low levels of orexigens that remained constant after SFS, coupled with high levels of anorexigens at baseline and after SFS. Obeses showed higher appetite, increased baseline levels of orexigens, lower baseline levels of anorexigens and cytokines and two peaks of NPY after SFS. The different patterns of ARPr and cytokines pointed to a close relationship with uremic insulin resistance. In fact, the euglycemic-hyperglycemic clamp reproduced these disorders. In anorexics, TNF-α fat expression was increased. In obese patients, leptin expression in fat tissue was down-regulated and showed correlation with the appetite. Conclusion: In PD, appetite is governed by substances that are altered at baseline and abnormally released. Such modulators are controlled by insulin metabolism and cytokines and, while anorexics display inflammatory predominance, obese patients predominantly display insulin resistance.

Keywords: appetite peptides; euglycemic–hyperglycemic clamp; fat tissue gene expression; insulin resistance; peritoneal dialysis; pro-inflammatory cytokines.


Figures
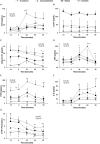
FIGURE 1
FIGURE 1
Abnormal anorexigen peptide and pro-inflammatory cytokine release in PD patients with eating behavior disorders. Panel (A) shows the CCK release after food consumption. Anorexic patients show a very important increase 30 min after FresubinTM intake that fell slightly at 60 and 90 min without reaching the basal CCK values. This peak explains the poor appetite (VAS) and the early satiety showed by these patients after food intake (Tables 1–3). The remaining groups had flat curves, except for the controls that maintained the peak values at 30 and 60 min. Obese patients did not show differences along of the curve. P < 0.0001 global statistical difference between the groups (three factor ANOVA test). Panel (B) shows flat curves of leptin without any modification over time. All PD patients had high basal leptin plasma levels especially the obese group. P < 0.01 (three factor ANOVA test). Panel (C) shows high adiponectin levels in PD patients, especially in the anorexic and asymptomatic patients when compared with the controls. All PD groups show a progressive and significant decrease over time and the control subjects show a peak at 30 min that fell at 90 min. Panel (D) shows the changes in plasma CRF levels after food intake. In normal conditions, CRF levels peak at 30 min and then decrease to values in the normal range after 90 min (controls) p < 0.001 (three factor ANOVA test). However, anorexic patients show an important elevation at 60 min possibly perpetuating the lack of appetite started by the CCK peak at 30 min (A) and the high basal adiponectin levels (C). P < 0.01 (three factor ANOVA test). Panel (E) shows the changes in TNF-α plasma levels after standard food intake. Anorexic patients show the highest basal plasma levels and they increase to nearly 200 pg/mL at 30 min, returning to the basal levels after 90 min. Obese and asymptomatic patients have parallel curves with peaks at 30 min and returning to basal levels after 60 min. P < 0.01 (three factor ANOVA test). Panel (F) shows the changes in IL-6 and the important peak developed by the anorexics patients at 30 min that continued to rise slowly to a maximum after 90 min. In the remaining groups IL-6 peaked at 30 min but it decreased at 60 and 90 min. Panel (G) shows the changes in sTNFα-R2 for which the anorexic patients again had the highest values that decrease after eating, while maintaining the highest values over the entire time of the curve. However, after its levels fall at 60 and 90 min, they remained constant. Obese and asymptomatic patients and the controls showed parallel falls. P < 0.001 (three factor ANOVA test).
FIGURE 2
FIGURE 2
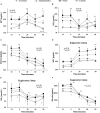
Abnormal orexigenic peptide release (spontaneous and after euglycemic clamp) in PD patients with eating behavior disorders. All PD patients have higher NPY plasma levels (the most orexigenic peptide known) than controls (A). P < 0.01 (three factor ANOVA test). In the control group, NPY levels peaked at 30 min followed by a decrease at 60 and 90 min to values below the baseline. Importantly, obese patients show a peak (the highest) at 30 min with a mild fall at 60 min and a rebound at 90 min. The appetite desire shows important correlation with these peaks (Table 2). Asymptomatic and anorexic patients show almost “flat curves.” With regards NO (represented by NO3), we found important baseline differences between PD patients and controls. After food intake, all patients show an important fall in plasma NO3 levels at 30 min, except asymptomatic patients that show this fall at 60 min with a rebound at 90 min. Obese patients show an early fall, rebound at 60 min and a second fall at 90 min. Anorexic patients had a similar curve as the rest but they did not show a second fall (B). P < 0.01 (three factor ANOVA test). The basal ghrelin plasma levels were higher in obese and lower in anorexic patients and an important fall occurs in all patients that is most pronounced in the anorexic patients (C). P < 0.01 (three factor ANOVA test). Variance multi-factor analysis (ANOVA). Euglycemic clamp reproduced the abnormalities in orexigenic peptide release found in PD patients. After glucose and insulin infusion, the change in NPY in obese patients shows an important peak at 30 min that was maintained during the study (D). P < 0.001 (three factor ANOVA test). Controls and the anorexic patients had lower values than the baseline with a virtually flat curve. The basal plasma NO3 levels were higher in the PD patients than in the controls, showing a strong fall to reach similar values as in the controls at 30 min (E). P < 0.01 (three factor ANOVA test). The plasma NO3 levels were very similar between the groups at later times. With regards ghrelin, the obese patients have higher plasma levels and the anorexic patients the lowest. There was a decrease in NO3 after glucose and insulin infusion that followed a very similar pattern in all groups. P < 0.01 (three factor ANOVA test). P < 0.01 (three factor ANOVA test). The plasma NO3 levels were very similar between the groups at later times. There was a decrease in NO3 after glucose and insulin infusion that followed a very similar pattern in all groups. With regards ghrelin (F) the obese patients have higher plasma levels and the anorexic patients the lowest. P < 0.01 (three factor ANOVA test).
FIGURE 3
FIGURE 3
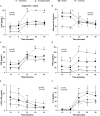
Euglycemic clamp reproduced the abnormalities in anorexigenic peptide pro-and inflammatory cytokine release found in PD patients. A euglycemic clamp permits us to evaluate the effect of insulin and exogenous glucose administration on ARPr, by-passing the gastrointestinal tract. The hyperglycemia and hyperinsulinemia induced are sufficient to abnormally release CCK (A). P < 0.001 (three factor ANOVA test). Anorexic patients maintain their CCK peak when compared with the remaining groups. With regards adiponectin, PD patients had higher plasma levels when comparison to the controls (B). P < 0.001 (three factor ANOVA test). The obese patients show lower values than the anorexic and asymptomatic patients. All PD patients showed an important fall between 30 and 90 min. By contrast, controls had elevated levels that peaked at 30 min and then fell at 60 and 90 min. Another important anorexigen substance, CRF, also shows important changes and in anorexic patients high levels were reached at 60 min that were maintained until 90 min. The remaining groups show intermediate peaks (C). P < 0.01 (three factor ANOVA test). The changes TNF-α, IL-6, and sTNFα-R2 after glucose and insulin infusion are shown in (D–F). Euglycemic clamp reproduced the different curves from anorexic, obese and asymptomatic patients and controls found after eating. However, the ends of the curves (60 and 90 min) were flat, possibly due to the stable and high insulin and glucose levels maintained by the euglycemic clamp. P < 0.001 (three factor ANOVA test).
FIGURE 4
FIGURE 4
Expression of genes related to eating behavior disorders in PD patients in abdominal subcutaneous fat (qPCR). PD patients show higher fat tissue TNF-α expression than controls. The highest TNF-α expression was in the anorexic patients, with obese and asymptomatic patients showing intermediate expression. The high TNF-α plasma levels present in anorexic patients did not inhibit the TNF-α expression in fat suggesting that in uremia, fat tissue is an important source of pro-inflammatory cytokines (A). With regards leptin expression in fat tissue, the obese patients show an important downregulation of leptin gene expression in fat when compared to the remaining groups. This down expression may be associated with a negative feedback loop induced by the high plasma TNF-α levels. Anorexic and asymptomatic patients express intermediate levels of leptin between obese patients and controls (B). Panel (C) shows the adiponectin expression, which was lower in the fat from PD patients than in controls. As expected, obese patients expressed adiponectin the weakest and again, anorexic and asymptomatic patients had expression levels intermediate to those of obese patients and controls. Box plots show the 25th and 75th percentiles, median, minimum and maximum values of five independent experiments. The symbols represent the statistical differences between the groups (ANOVA one-way and Mann–Whitney rank sum U test).

Similar articles

Cited by

References

    1. Adrian J. M., Bloom S. R., Ghatei M. A., Rossor M. N., Roberts G. W., et al. (1983). Neuropeptide Y distribution in human brain. Nature 306 584–586. - PubMed
    1. Aguilera A., Cirugeda A., Amair R., Sansone G., Alegre L., Codoceo R., et al. (2004a). Ghrelin plasma levels and appetite in peritoneal dialysis patients. Adv. Perit. Dial. 20 194–199. - PubMed
    1. Aguilera A., Selgas R., Díez J. J., Bajo M. A., Codoceo R., Alvarez V. (2004b). Eating behavior disorders in uremia: a question of balance in appetite regulation. Semin. Dial. 17 44–52. - PubMed
    1. Aguilera A., Codoceo R., Bajo M. A., Díez J. J., Del Peso G., Pavone M., et al. (2001). Helicobacter pylori infection: a new cause of anorexia in peritoneal dialysis patients. Perit. Dial. Int. 21 S152–S156. - PubMed
    1. Aguilera A., Codoceo R., Bajo M. A., Iglesias P., Diéz J. J., Barril G., et al. (1998). Anorexigen (TNF-α, cholecystokinin) and orexigen (neuropeptide Y) plasma levels in peritoneal dialysis (PD): their relationship with nutritional parameters. Nephrol. Dial. Transplant. 13 1476–1483. - PubMed