

Six Weeks of Low-Load Blood Flow Restricted and High-Load Resistance Exercise Training Produce Similar Increases in Cumulative Myofibrillar Protein Synthesis and Ribosomal Biogenesis in Healthy Males
- PMID: 31191347
- PMCID: PMC6548815
- DOI: 10.3389/fphys.2019.00649
Six Weeks of Low-Load Blood Flow Restricted and High-Load Resistance Exercise Training Produce Similar Increases in Cumulative Myofibrillar Protein Synthesis and Ribosomal Biogenesis in Healthy Males
Abstract
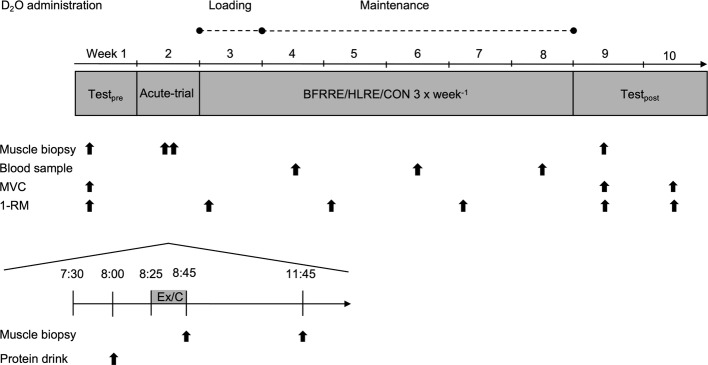
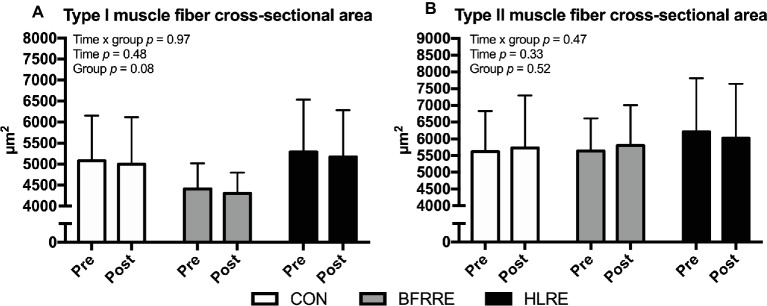
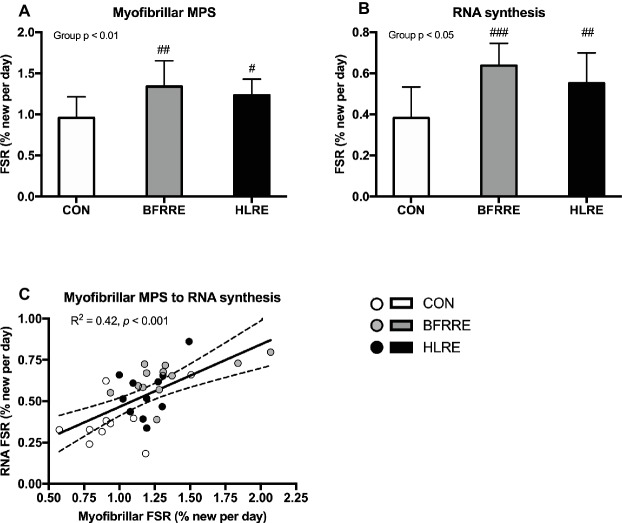
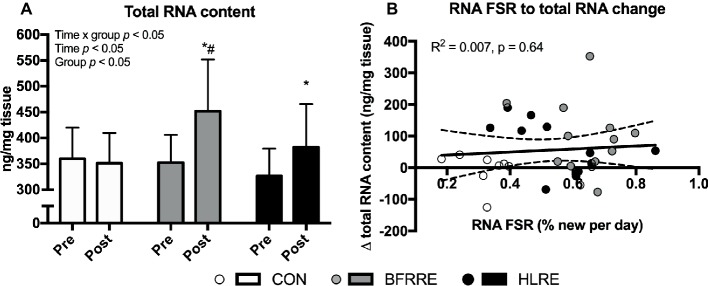
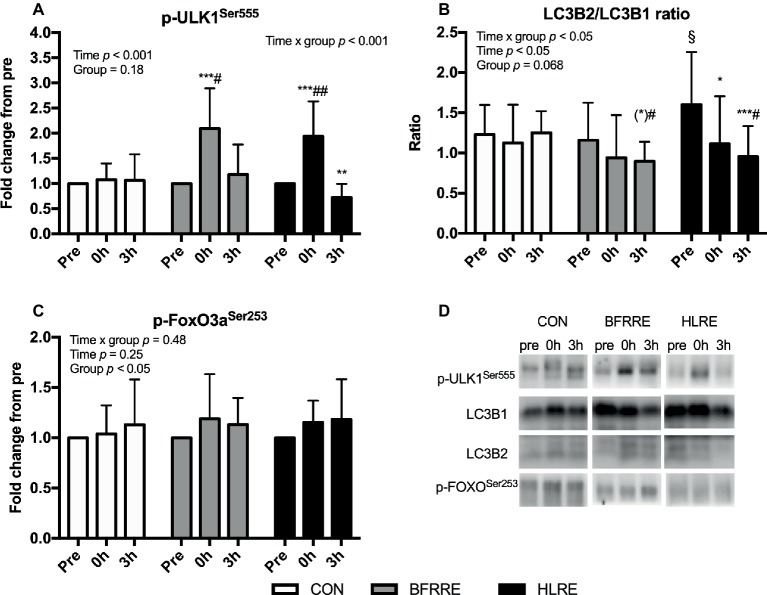
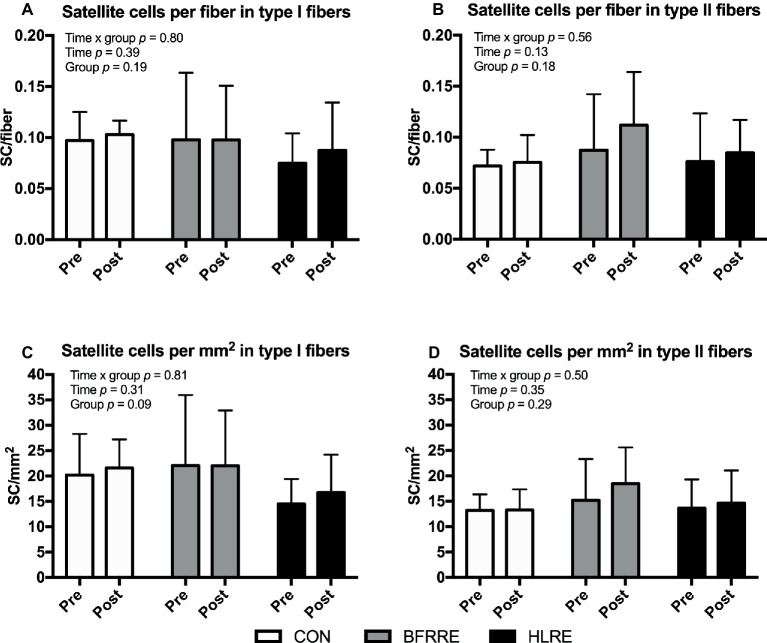
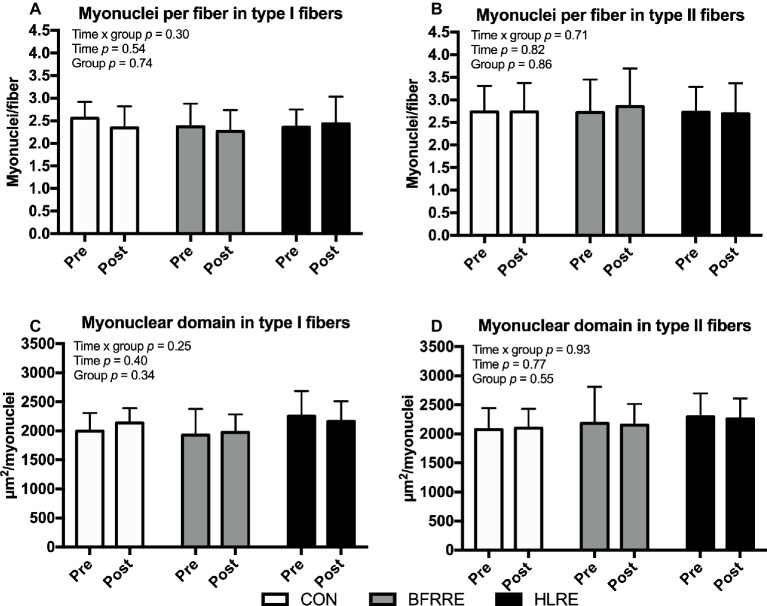
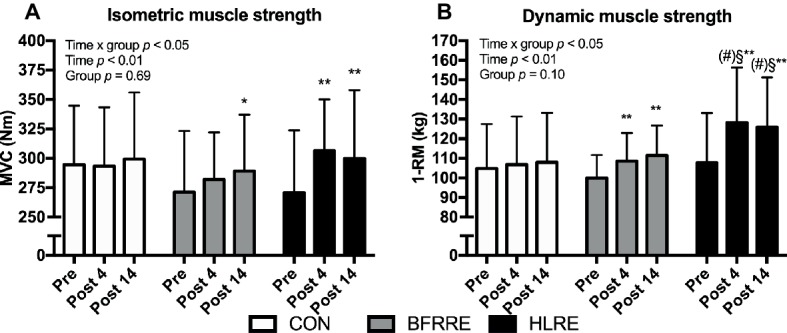
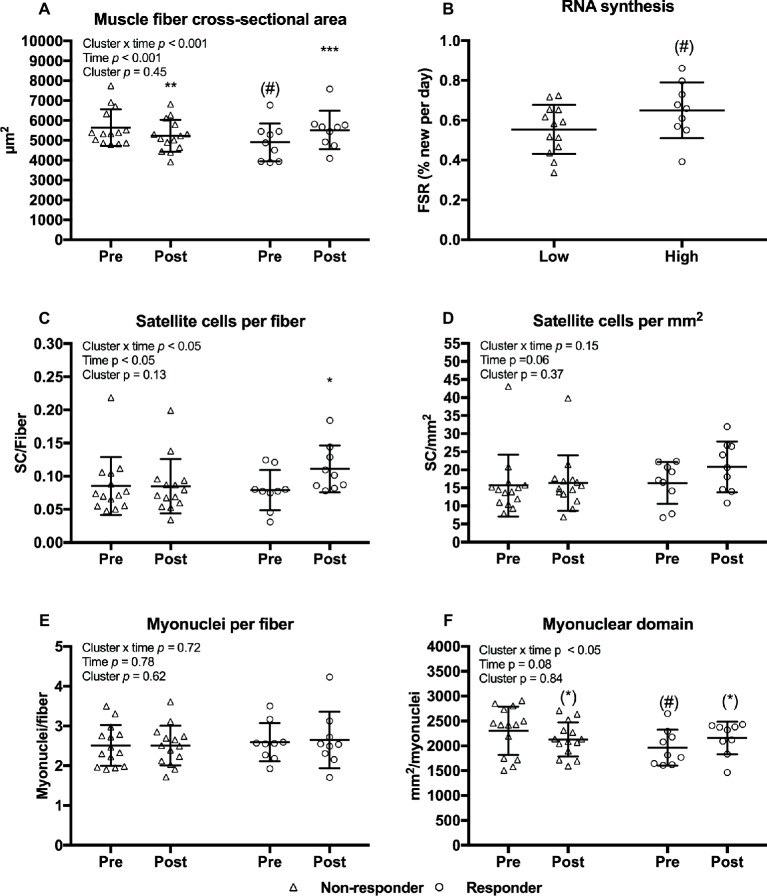
Purpose: High-load resistance exercise contributes to maintenance of muscle mass, muscle protein quality, and contractile function by stimulation of muscle protein synthesis (MPS), hypertrophy, and strength gains. However, high loading may not be feasible in several clinical populations. Low-load blood flow restricted resistance exercise (BFRRE) may provide an alternative approach. However, the long-term protein synthetic response to BFRRE is unknown and the myocellular adaptations to prolonged BFRRE are not well described. Methods: To investigate this, 34 healthy young subjects were randomized to 6 weeks of low-load BFRRE, HLRE, or non-exercise control (CON). Deuterium oxide (D2O) was orally administered throughout the intervention period. Muscle biopsies from m. vastus lateralis were collected before and after the 6-week intervention period to assess long-term myofibrillar MPS and RNA synthesis as well as muscle fiber-type-specific cross-sectional area (CSA), satellite cell content, and myonuclei content. Muscle biopsies were also collected in the immediate hours following single-bout exercise to assess signaling for muscle protein degradation. Isometric and dynamic quadriceps muscle strength was evaluated before and after the intervention. Results: Myofibrillar MPS was higher in BFRRE (1.34%/day, p < 0.01) and HLRE (1.12%/day, p < 0.05) compared to CON (0.96%/day) with no significant differences between exercise groups. Muscle RNA synthesis was higher in BFRRE (0.65%/day, p < 0.001) and HLRE (0.55%/day, p < 0.01) compared to CON (0.38%/day) and both training groups increased RNA content, indicating ribosomal biogenesis in response to exercise. BFRRE and HLRE both activated muscle degradation signaling. Muscle strength increased 6-10% in BFRRE (p < 0.05) and 13-23% in HLRE (p < 0.01). Dynamic muscle strength increased to a greater extent in HLRE (p < 0.05). No changes in type I and type II muscle fiber-type-specific CSA, satellite cell content, or myonuclei content were observed. Conclusions: These results demonstrate that BFRRE increases long-term muscle protein turnover, ribosomal biogenesis, and muscle strength to a similar degree as HLRE. These findings emphasize the potential application of low-load BFRRE to stimulate muscle protein turnover and increase muscle function in clinical populations where high loading is untenable.
Keywords: deuterium oxide; ischemic resistance training; myofibrillar protein synthesis; remodeling; ribosomal biogenesis.
Figures
Similar articles
-
Skeletal Muscle Mitochondrial Protein Synthesis and Respiration Increase With Low-Load Blood Flow Restricted as Well as High-Load Resistance Training.Front Physiol. 2018 Dec 17;9:1796. doi: 10.3389/fphys.2018.01796. eCollection 2018. Front Physiol. 2018. PMID: 30618808 Free PMC article.
-
Low-load blood flow-restricted resistance exercise produces fiber type-independent hypertrophy and improves muscle functional capacity in older individuals.J Appl Physiol (1985). 2023 Apr 1;134(4):1047-1062. doi: 10.1152/japplphysiol.00789.2022. Epub 2023 Feb 24. J Appl Physiol (1985). 2023. PMID: 36825645 Free PMC article. Clinical Trial.
-
Type 1 Muscle Fiber Hypertrophy after Blood Flow-restricted Training in Powerlifters.Med Sci Sports Exerc. 2019 Feb;51(2):288-298. doi: 10.1249/MSS.0000000000001775. Med Sci Sports Exerc. 2019. PMID: 30188363 Clinical Trial.
-
Muscle fibre activation and fatigue with low-load blood flow restricted resistance exercise-An integrative physiology review.Acta Physiol (Oxf). 2020 Jan;228(1):e13302. doi: 10.1111/apha.13302. Epub 2019 Jun 18. Acta Physiol (Oxf). 2020. PMID: 31108025 Review.
-
Myocellular Adaptations to Low-Load Blood Flow Restricted Resistance Training.Exerc Sport Sci Rev. 2020 Oct;48(4):180-187. doi: 10.1249/JES.0000000000000231. Exerc Sport Sci Rev. 2020. PMID: 32658044 Review.
Cited by
-
Sarcopenia Coexisting with High Adiposity Exacerbates Insulin Resistance and Dyslipidemia in Saudi Adult Men.Diabetes Metab Syndr Obes. 2020 Aug 25;13:3089-3097. doi: 10.2147/DMSO.S260382. eCollection 2020. Diabetes Metab Syndr Obes. 2020. PMID: 32922058 Free PMC article.
-
Short-term repeated human biopsy sampling contributes to changes in muscle morphology and higher outcome variability.J Appl Physiol (1985). 2023 Dec 1;135(6):1403-1414. doi: 10.1152/japplphysiol.00441.2023. Epub 2023 Sep 14. J Appl Physiol (1985). 2023. PMID: 37705447 Free PMC article.
-
Comparative Perceptual, Affective, and Cardiovascular Responses between Resistance Exercise with and without Blood Flow Restriction in Older Adults.Int J Environ Res Public Health. 2022 Nov 30;19(23):16000. doi: 10.3390/ijerph192316000. Int J Environ Res Public Health. 2022. PMID: 36498075 Free PMC article. Clinical Trial.
-
A novel short-course, low-intensity blood-flow-restricted exercise (BFRE) regimen to study satellite cell function in critical illness survivors with sustained muscle atrophy following intensive care unit-acquired weakness (ICUAW).Front Physiol. 2025 Jun 18;16:1553471. doi: 10.3389/fphys.2025.1553471. eCollection 2025. Front Physiol. 2025. PMID: 40606234 Free PMC article.
-
Muscle from aged rats is resistant to mechanotherapy during atrophy and reloading.Geroscience. 2021 Feb;43(1):65-83. doi: 10.1007/s11357-020-00215-y. Epub 2020 Jun 25. Geroscience. 2021. PMID: 32588343 Free PMC article.
References
-
- Aagaard P., Andersen J. L., Dyhre-Poulsen P., Leffers A. M., Wagner A., Magnusson S. P., et al. . (2001). A mechanism for increased contractile strength of human pennate muscle in response to strength training: changes in muscle architecture. J. Physiol. 534, 613–623. 10.1111/j.1469-7793.2001.t01-1-00613.x, PMID: - DOI - PMC - PubMed
Grants and funding
LinkOut - more resources
Full Text Sources
Medical