. 2019 May 22:10:1116.
doi: 10.3389/fmicb.2019.01116. eCollection 2019.

Dynamic Alterations in Yak Rumen Bacteria Community and Metabolome Characteristics in Response to Feed Type

Affiliations

Dynamic Alterations in Yak Rumen Bacteria Community and Metabolome Characteristics in Response to Feed Type

Chang Liu et al. Front Microbiol. .

Abstract

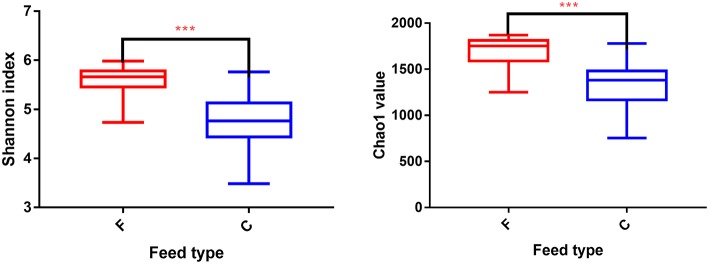
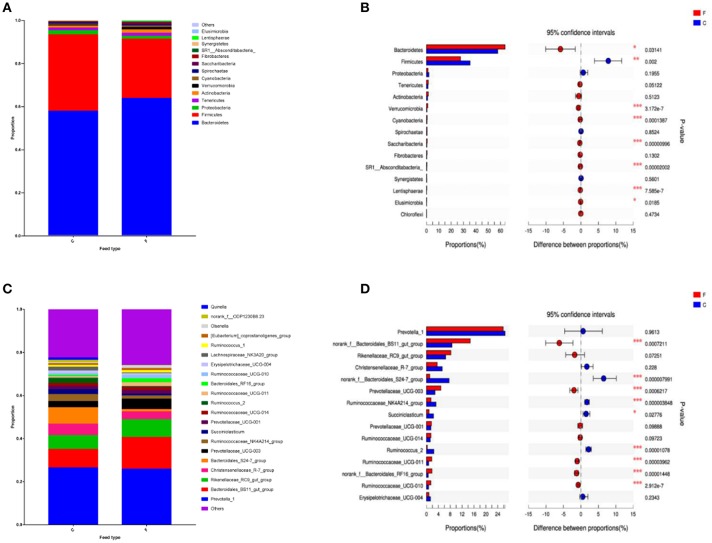
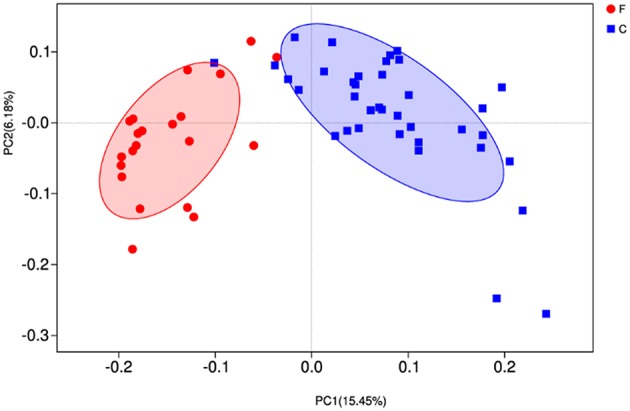
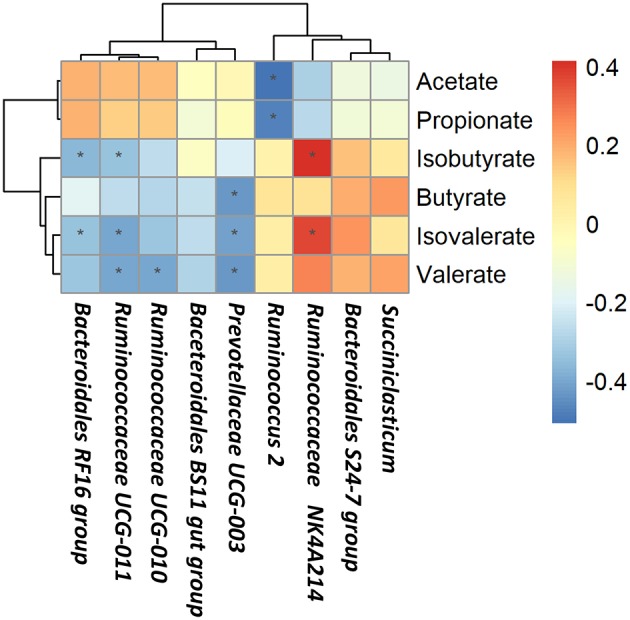
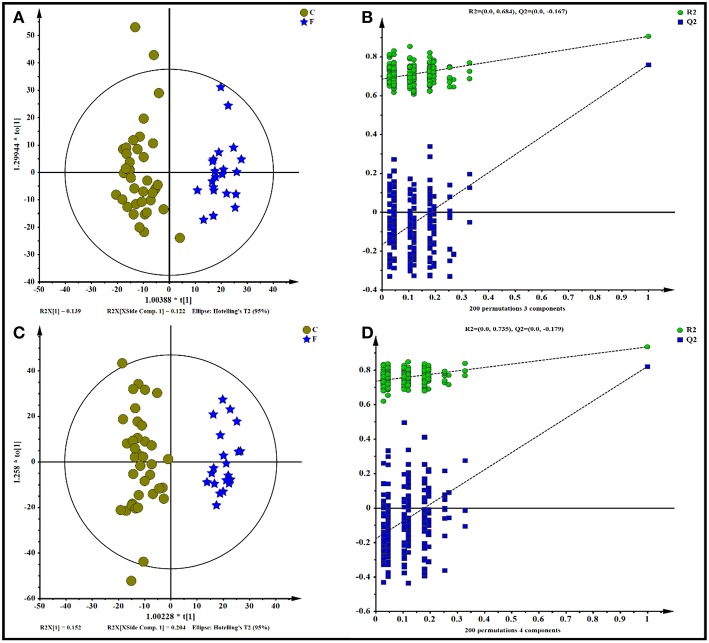
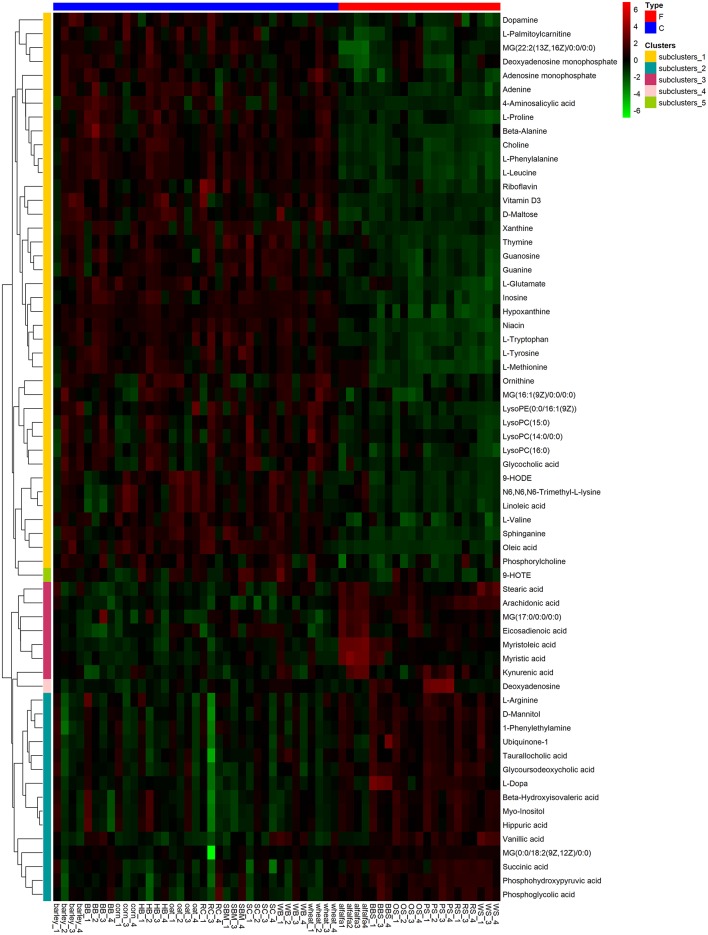
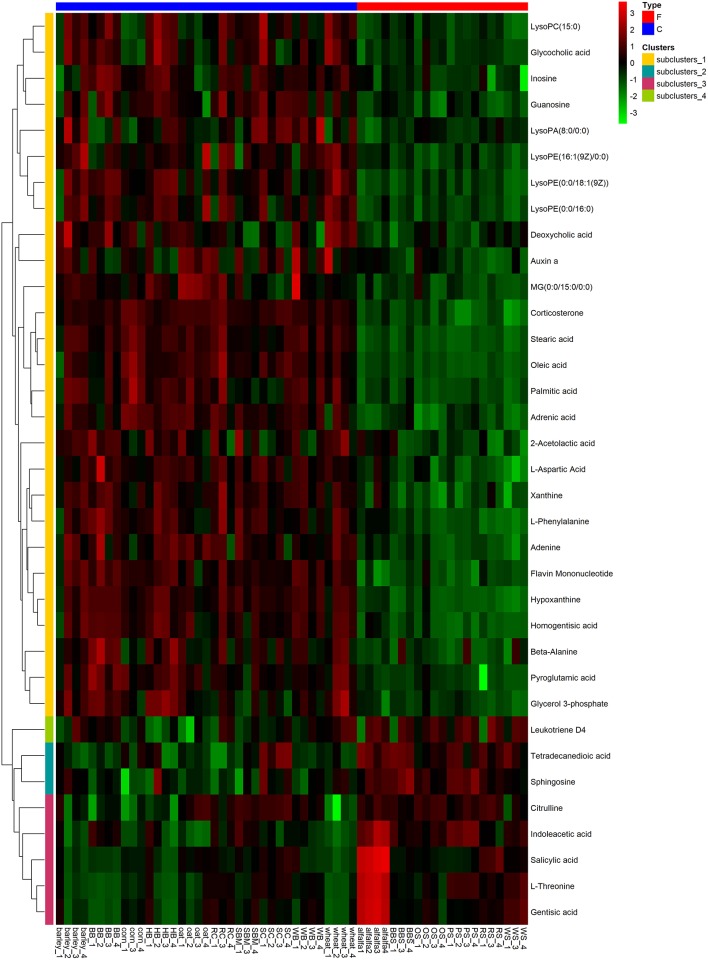
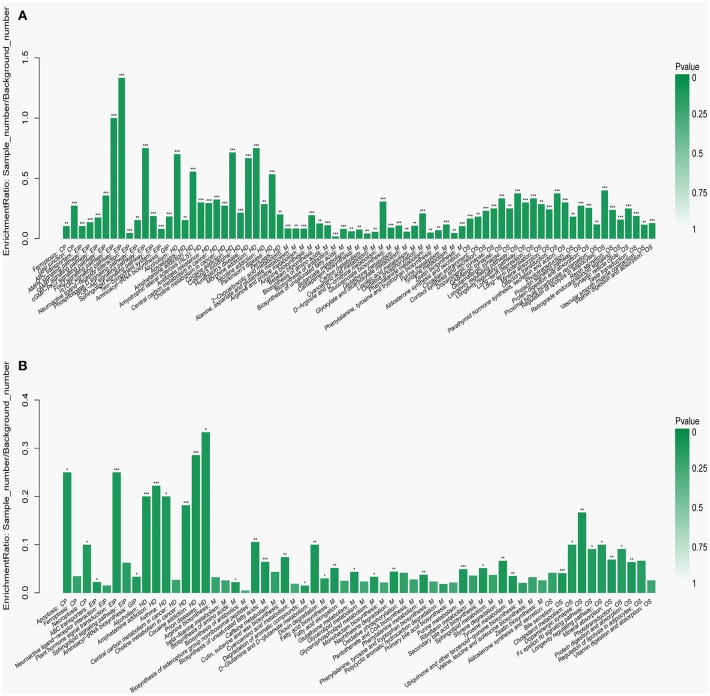
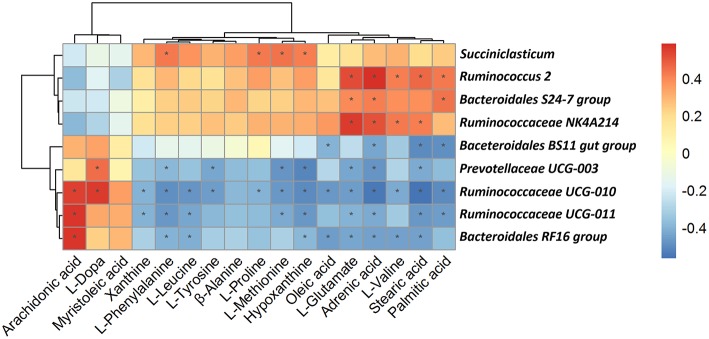
Current knowledge about the relationships between ruminal bacterial communities and metabolite profiles in the yak rumen is limited. This is due to differences in the nutritional and metabolic features between yak and other ordinary cattle combined with difficulties associated with farm-based research and a lack of technical guidance. A comprehensive analysis of the composition and alterations in ruminal metabolites is required to advance the development of modern yak husbandry. In the current study, we characterized the effect of feed type on the ruminal fluid microbiota and metabolites in yak using 16S rRNA gene sequencing and liquid chromatography-mass spectrometry (LC-MS). Bacteroidetes and Firmicutes were the predominant bacterial phyla in the yak rumen. At the genus level, the relative abundance of Bacteroidales BS11 gut group, Prevotellaceae UCG-003, Ruminococcaceae UCG-011, Bacteroidales RF16 group and Ruminococcaceae UCG-010 was significantly (P < 0.01) higher in the forage group compared to that in the concentrate group, while the concentrate group harbored higher proportions of Bacteroidales S24-7 group, Ruminococcaceae NK4A214, Succiniclasticum and Ruminococcus 2. Yak rumen metabolomics analysis combined with enrichment analysis revealed that feed type altered the concentrations of ruminal metabolites as well as the metabolic pattern, and significantly (P < 0.01) affected the concentrations of ruminal metabolites involved in protein digestion and absorption (e.g., L-arginine, ornithine, L-threonine, L-proline and β-alanine), purine metabolism (e.g., xanthine, hypoxanthine, deoxyadenosine and deoxyadenosine monophosphate) and fatty acid biosynthesis (e.g., stearic acid, myristic acid and arachidonic acid). Correlation analysis of the association of microorganisms with metabolite features provides us with a comprehensive understanding of the composition and function of microbial communities. Associations between utilization or production were widely identified between affected microbiota and certain metabolites, and these findings will contribute to the direction of future research in yak.

Keywords: feed type; metabolomics; microbiota; rumen; yak.


Figures

Figure 1
Figure 1
Differences in Yak ruminal bacterial diversity and richness between the concentrate and forage groups. Bacterial diversity was estimated by Shannon index. Bacterial richness estimated by the Chao1 value. C, concentrate group; F, forage group. ***indicate significant difference between the Concentrate Group and the Forage Group (P ≤ 0.001).
Figure 2
Figure 2
Classification of the bacterial community composition across the forage and concentrate groups. (A) Phylum level. (B) Extended error bar plot showing the bacteria at the phylum level that had significant differences between the concentrate and forage groups. (C) Genus level. (D) Extended error bar plot showing the bacteria at the genus level that had significant differences between the concentrate and forage groups. Positive differences indicate greater abundance of bacteria at the phylum level and at the genus level in the concentrate group, while negative differences indicate greater abundance in the forage group. C, concentrate group; F, forage group. Asterisks indicate significant difference between the Concentrate Group and the Forage Group (*0.01 < P ≤ 0.05; **0.001 < P ≤ 0.01; ***P ≤ 0.001).
Figure 3
Figure 3
Principal coordinate analysis (PCoA) of rumen microbial communities. C, concentrate group; F, forage group.
Figure 4
Figure 4
Correlations between rumen bacteria and rumen fermentation parameters. Each row in the graph represents a genus, each column represents a metabolite, and each lattice represents a Pearson correlation coefficient between a component and a metabolite. Red represents a positive correlation, while blue represents a negative correlation. *Significant correlation between the concentrate and forage groups (P < 0.05).
Figure 5
Figure 5
Orthogonal partial least squares discriminant analysis [(O)PLS-DA] plot of yak rumen metabolites in comparisons of the concentrate and forage groups following (A,B) positive and (C,D) negative mode ionization.
Figure 6
Figure 6
Hierarchical clustering analysis for identification of different metabolites in yak rumen by comparison of the concentrate and forage groups following positive mode ionization. Each column in the figure represents a sample, each row represents a metabolite, and the color indicates the relative amount of metabolites expressed in the group; Red indicates that the metabolite is expressed at high levels, and green indicates lower expression.
Figure 7
Figure 7
Hierarchical clustering analysis for identification of different metabolites in yak rumen by comparison of the concentrate and forage groups following negative mode ionization. Each column in the figure represents a sample, each row represents a metabolite, and the color indicates the relative amount of metabolites expressed in the group; Red indicates that the metabolite is expressed at high levels, and green indicates lower expression.
Figure 8
Figure 8
Metabolic pathway enrichment analysis following (A) positive and (B) negative mode ionization. Overview of metabolites that were enriched in the concentrate group compared to the forage group. CP, EIP, GIP, HD, M, and OS are the class names of the metabolic pathways in the KEGG annotation. CP, Cellular Processes; EIP, Environmental Information Processing; GIP, Genetic Information Processing; HD, Human Diseases; M, Metabolism; OS, Organismal Systems. These were added as suggested (*P < 0.05; **P < 0.01; ***P < 0.001).
Figure 9
Figure 9
Correlation analysis between genera and metabolite concentrations affected by the feed type. Each row in the graph represents a genus, each column represents a metabolite, and each lattice represents a Pearson correlation coefficient between a component and a metabolite. Red represents a positive correlation, while blue represents a negative correlation. *Significant correlation between the concentrate and forage groups (P < 0.05).

References

    1. Allison M. J. (1969). Biosynthesis of amino acids by ruminal microorganisms. J. Anim. Sci. 29, 797–807. 10.2527/jas1969.295797x - DOI - PubMed
    1. Ametaj B. N., Zebeli Q., Saleem F., Psychogios N., Lewis M. J., Dunn S. M., et al. (2010). Metabolomics reveals unhealthy alterations in rumen metabolism with increased proportion of cereal grain in the diet of dairy cows. Metabolomics 6, 583–594. 10.1007/s11306-010-0227-6 - DOI
    1. Anderson C. L., Schneider C. J., Erickson G. E., MacDonald J. C., Fernando S. C. (2016). Rumen bacterial communities can be acclimated faster to high concentrate diets than currently implemented feedlot programs. J. Appl. Microbiol. 120, 588–599. 10.1111/jam.13039 - DOI - PMC - PubMed
    1. Artegoitia V. M., Foote A. P., Lewis R. M., Freetly H. C. (2017). Rumen fluid metabolomics analysis associated with feed efficiency on crossbred steers. Sci. Rep. 7:2864. 10.1038/s41598-017-02856-0 - DOI - PMC - PubMed
    1. Bainbridge M. L., Saldinger L. K., Barlow J. W., Alvez J. P., Roman J., Kraft J. (2018). Alteration of rumen bacteria and protozoa through grazing regime as a tool to enhance the bioactive fatty acid content of bovine milk. Front. Microbiol. 9:904. 10.3389/fmicb.2018.00904 - DOI - PMC - PubMed

LinkOut - more resources