. 2019 May 28:10:1189.
doi: 10.3389/fmicb.2019.01189. eCollection 2019.

Three Capsular Polysaccharide Synthesis-Related Glucosyltransferases, GT-1, GT-2 and WcaJ, Are Associated With Virulence and Phage Sensitivity of Klebsiella pneumoniae

Affiliations

Three Capsular Polysaccharide Synthesis-Related Glucosyltransferases, GT-1, GT-2 and WcaJ, Are Associated With Virulence and Phage Sensitivity of Klebsiella pneumoniae

Ruopeng Cai et al. Front Microbiol. .

Abstract

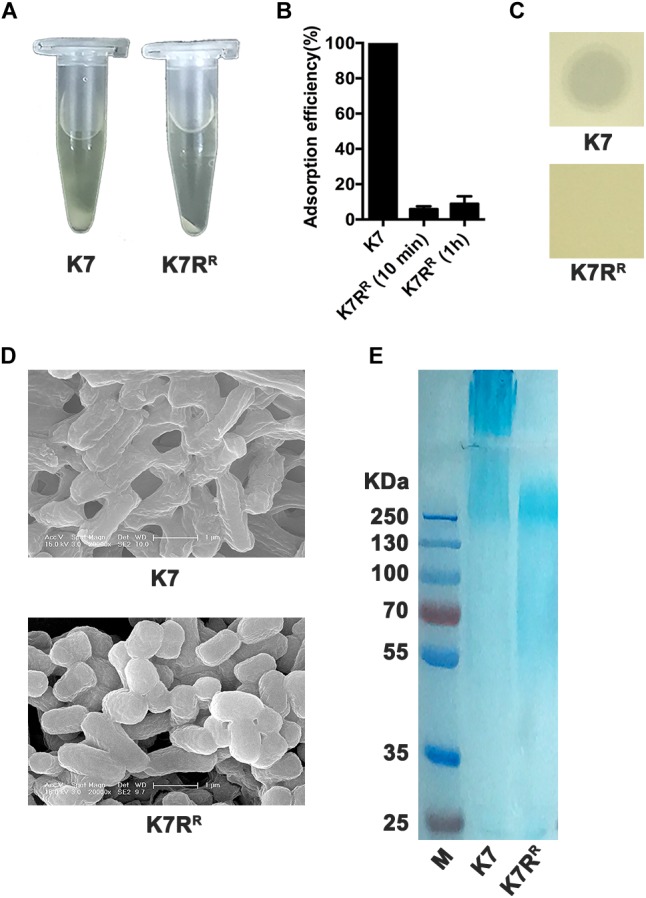
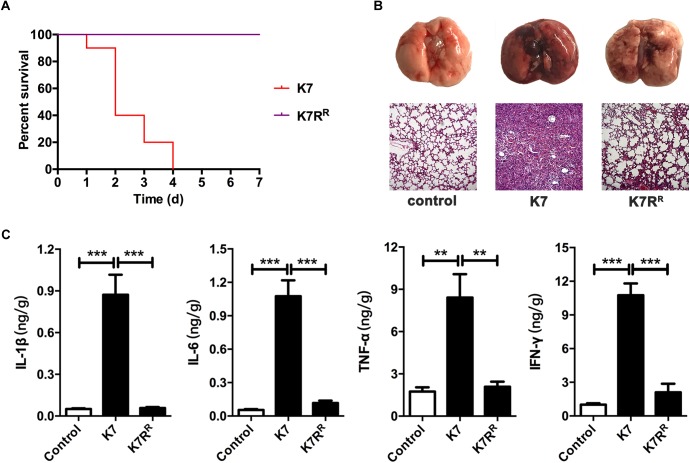
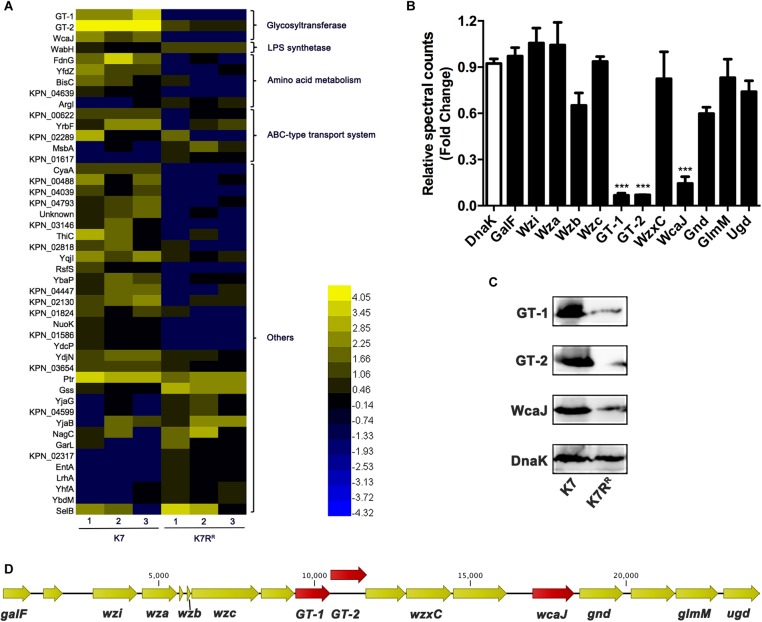
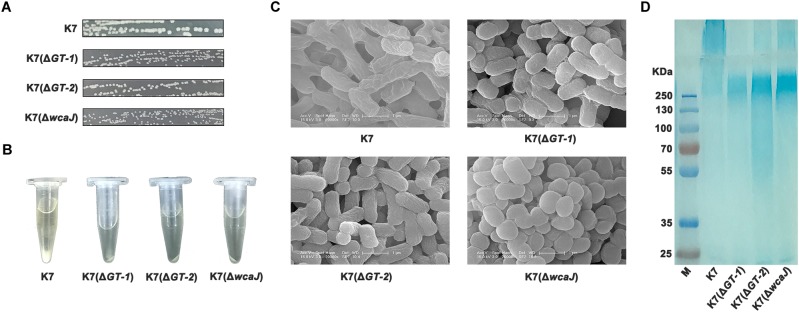
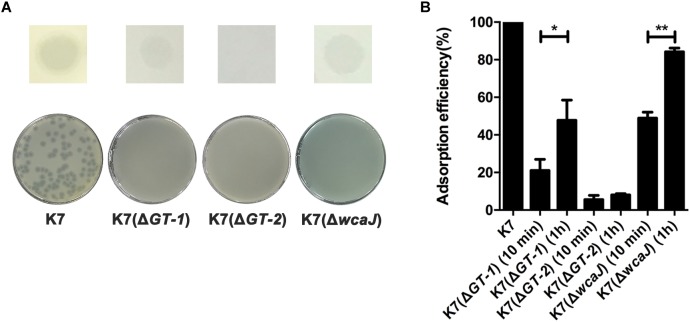
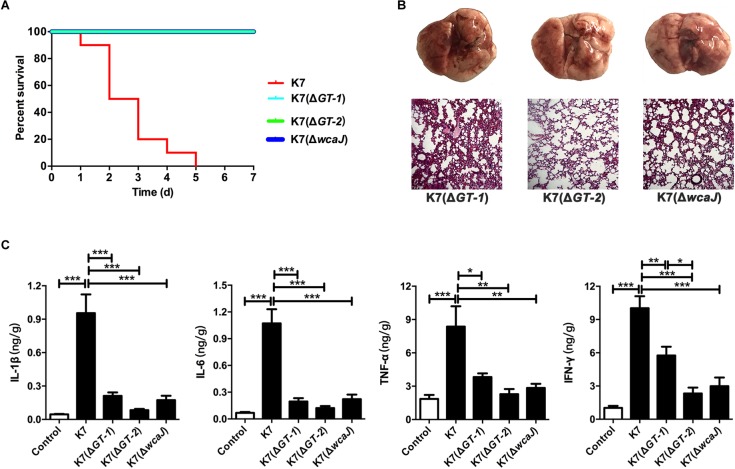
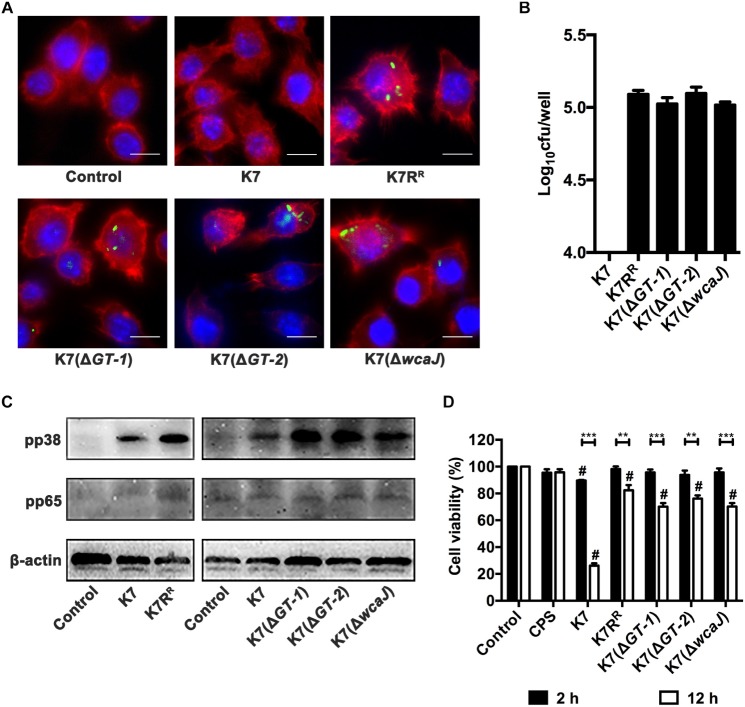
Klebsiella pneumoniae (K. pneumoniae) spp. are important nosocomial and community-acquired opportunistic pathogens, which cause various infections. We observed that K. pneumoniae strain K7 abruptly mutates to rough-type phage-resistant phenotype upon treatment with phage GH-K3. In the present study, the rough-type phage-resistant mutant named K7RR showed much lower virulence than K7. Liquid chromatography-tandem mass spectrometry (LC-MS-MS) analysis indicated that WcaJ and two undefined glycosyltransferases (GTs)- named GT-1, GT-2- were found to be down-regulated drastically in K7RR as compared to K7 strain. GT-1, GT-2, and wcaJ are all located in the gene cluster of capsular polysaccharide (CPS). Upon deletion, even of single component, of GT-1, GT-2, and wcaJ resulted clearly in significant decline of CPS synthesis with concomitant development of GH-K3 resistance and decline of virulence of K. pneumoniae, indicating that all these three GTs are more likely involved in maintenance of phage sensitivity and bacterial virulence. Additionally, K7RR and GT-deficient strains were found sensitive to endocytosis of macrophages. Mitogen-activated protein kinase (MAPK) signaling pathway of macrophages was significantly activated by K7RR and GT-deficient strains comparing with that of K7. Interestingly, in the presence of macromolecular CPS residues (>250 KD), K7(ΔGT-1) and K7(ΔwcaJ) could still be bounded by GH-K3, though with a modest adsorption efficiency, and showed minor virulence, suggesting that the CPS residues accumulated upon deletion of GT-1 or wcaJ did retain phage binding sites as well maintain mild virulence. In brief, our study defines, for the first time, the potential roles of GT-1, GT-2, and WcaJ in K. pneumoniae in bacterial virulence and generation of rough-type mutation under the pressure of bacteriophage.

Keywords: Klebsiella pneumoniae; WcaJ; glucosyltransferase (GT); phage resistance; virulence.


Figures

FIGURE 1
FIGURE 1
Characteristics of K. pneumoniae K7 and K7RR. (A) Centrifugation analysis of K. pneumoniae K7 and K7RR. The cultures were centrifuged at 10,000 × g for 5 min at 4°C. (B) Adsorption efficiency of GH-K3 binding to K. pneumoniae K7 and K7RR. Data represent the mean ± SEM of triplicate experiments. (C) Spot assays for GH-K3 on K. pneumoniae K7 and K7RR. Five μl of phage solutions were spotted onto freshly lawns of K. pneumoniae K7 and K7RR for 6 h at 37°C before observation. (D) SEM analyses of the surface morphology of K. pneumoniae K7 and K7RR. Scale bars represent 1 μm. (E) CPS samples were extracted from equal amounts of K. pneumoniae strains (1.0 × 10⁹ CFU). After separated by 12% SDS-PAGE, CPS phenotypes of K7 and K7RR were visualized by alcian blue staining.
FIGURE 2
FIGURE 2
Virulence evaluation of K. pneumoniae K7 and K7RR in vivo. All the mice were challenged intranasally with 1 × 10⁷ CFU/mouse of K. pneumoniae K7 and K7RR. (A) Survival rates of mice challenged with K. pneumoniae K7 and K7RR. Each group contained ten mice. Statistical analysis was performed using the Kaplan–Meier method [P < 0.0001, log-rank (Mantel–Cox) test]. (B) Pathological observation. At 48 h after infection, the lungs from mice challenged with K. pneumoniae K7 and K7RR were carefully removed and photographed after euthanasia. Lung tissue sections were stained with hematoxylin and eosin (H&E) and then observed in a microscope at a magnification 100×. Lung tissues of healthy mice were served as controls. (C) The levels of cytokines. The levels of IL-1β, IL-6, TNF-α, and IFN-γ in lung tissue homogenates of mice infected by K. pneumoniae K7 and K7RR were determined. Lung tissue homogenates of healthy mice were served as controls. ∗∗ and ∗∗∗ represent significant differences at P < 0.01 and P < 0.001, respectively. Data represent the mean ± SEM of triplicate experiments.
FIGURE 3
FIGURE 3
The differentially expressed proteins between K. pneumoniae K7 and K7RR. (A) Heat-map analysis of differentially expressed proteins between K. pneumoniae K7 and K7RR. The heat-map was generated by Heml 1.0. Lanes 1–3 represent three biological replicates at each sampling time. Protein functional classification was performed by STRING, version 10.5. (B) Spectral count fold changes. The relative spectral counts of proteins encoded by cps gene cluster between K. pneumoniae K7 and K7RR were analyzed. DnaK served as a loading control. Relative spectral count fold changes = (spectral counts of K7RR)/(spectral counts of K7). ∗∗∗represents significant differences at P < 0.001. Data represent the mean ± SEM of triplicate biological experiments at each sampling time. (C) Western blot analyses of GT-1, GT-2, and WcaJ. Expression levels of GT-1, GT-2, and WcaJ in K. pneumoniae K7 and K7RR were detected. Expression of DnaK was detected as a control. (D) Schematic of cps gene cluster of K. pneumoniae K7 indicated by arrows with different colors. The arrow represents the direction of transcription.
FIGURE 4
FIGURE 4
Characteristics of K. pneumoniae K7(ΔGT-1), K7(ΔGT-2), and K7(ΔwcaJ). (A) Colony morphologies of K. pneumoniae K7(ΔGT-1), K7(ΔGT-2), and K7(ΔwcaJ). Colonies of K7(ΔGT-1), K7(ΔGT-2), and K7(ΔwcaJ) were cultured on LB plates at 37°C for 12 h after streak plating. The three mutant strains all form rough-type colonies. K7 was used as a control. (B) Centrifugation analysis of K. pneumoniae K7(ΔGT-1), K7(ΔGT-2), and K7(ΔwcaJ). The cultures were centrifuged at 10,000 × g for 5 min. K7 was used as a control. (C) SEM analyses of the surface morphology of K. pneumoniae K7(ΔGT-1), K7(ΔGT-2), and K7(ΔwcaJ). Scale bars represent 1 μm. K7 was used as a control. (D) CPS samples were extracted from equal amounts of K. pneumoniae strains (1.0 × 10⁹ CFU). After separated by 12% SDS-PAGE, CPS phenotypes of K7(ΔGT-1), K7(ΔGT-2), and K7(ΔwcaJ) were visualized by alcian blue staining. CPS of K7 was used as a control.
FIGURE 5
FIGURE 5
Sensitivity of K. pneumoniae K7(ΔGT-1), K7(ΔGT-2), and K7(ΔwcaJ) to GH-K3. (A) Spot and plaque forming assays. Five μl of GH-K3 solutions were spotted onto freshly seeded lawns of K. pneumoniae K7(ΔGT-1), K7(ΔGT-2), and K7(ΔwcaJ) for 6 h at 37°C before observation (top). Meanwhile, the sensitivity of K. pneumoniae K7(ΔGT-1), K7(ΔGT-2), and K7(ΔwcaJ) to GH-K3 were determined by plaque assays (bottom). K7 was used as a control. (B) Adsorption efficiency. The adsorption efficiency of GH-K3 binding to K. pneumoniae K7(ΔGT-1), K7(ΔGT-2), and K7(ΔwcaJ) were determined. and ∗∗ significant differences at P < 0.05 and P < 0.01, respectively. Data represent the mean ± SEM of triplicate experiments.
FIGURE 6
FIGURE 6
Virulence evaluation of K. pneumoniae K7(ΔGT-1), K7(ΔGT-2), and K7(ΔwcaJ). All the mice were challenged intranasally with 1 × 10⁷ CFU/mouse of K. pneumoniae K7, K7(ΔGT-1), K7(ΔGT-2), and K7(ΔwcaJ). (A) Survival rates. Survival rates of mice challenged with K. pneumoniae K7(ΔGT-1), K7(ΔGT-2), and K7(ΔwcaJ) were determined. Each group contained ten mice. Statistical analysis was performed using the Kaplan–Meier method by [P < 0.0001, log-rank (Mantel-Cox) test]. (B) Pathological observation. At 48 h after infection, the lungs of mice challenged with K. pneumoniae K7(ΔGT-1), K7(ΔGT-2), and K7(ΔwcaJ) were carefully removed and photographed after euthanasia. Lung tissue sections were stained with H&E and then observed in a microscope at a magnification 100×. Lung tissues of healthy mice were served as controls. (C) The levels of four cytokines. The levels of IL-1β, IL-6, TNF-α, and IFN-γ in lung tissue homogenates of mice infected by K. pneumoniae K7(ΔGT-1), K7(ΔGT-2), and K7(ΔwcaJ) were determined. Lung tissue homogenates of healthy mice were served as controls. , ∗∗, and ∗∗∗ represent significant differences at P < 0.05, P < 0.01, and P < 0.001, respectively. Data represent the mean ± SEM of triplicate experiments.
FIGURE 7
FIGURE 7
Endocytosis, activation and cytotoxicity of RAW264.7 cells after incubation with different K. pneumoniae strains. (A) Immunofluorescence analysis of endocytosis effects of RAW264.7 cells after incubation with different K. pneumoniae strains. K. pneumoniae K7, K7RR, K7(ΔGT-1), K7(ΔGT-2), and K7(ΔwcaJ) were stained with SYTOTM 9 Green Fluorescent Nucleic Acid Stain. The K. pneumoniae strains were then co-incubated with RAW264.7 cells in antibiotic-free supernatants. Cytoskeleton and nuclei were stained with Phalloidin-iFluor 555 and Hoechst 33342, respectively. The endocytosis of these K. pneumoniae strains in RAW264.7 cells was determined with a laser scanning confocal microscope and then observed at a magnification 1000× (scale bar, 10 μm. Images shown are representative of three independent experiments). (B) The bacterial loads of intracellular K. pneumoniae in RAW264.7 cells. Cells (5 × 10⁵) were incubated with K7, K7RR, K7(ΔGT-1), K7(ΔGT-2), and K7(ΔwcaJ) at 37°C for 2 h. After gentamicin treatment and cell lysis, bacterial loads in each cell samples were determined by plating. Data represent the mean ± SEM of triplicate experiments. (C) Expression levels of pp38 and pp65 in RAW264.7 cells after incubation with K. pneumoniae K7, K7RR, K7(ΔGT-1), K7(ΔGT-2), and K7(ΔwcaJ). Untreated cells were used as controls. β-actin served as a loading control. (D) Cytotoxicity analysis of RAW264.7 cells after incubation with purified CPS from K7 (10 μg) or different K. pneumoniae for 2 or 12 h. Cells without any treatment were served as controls and their viability was set as 100%. The statistical differences between different treatment groups and control group were labled with # (P < 0.05); the statistical differences of the same treatment groups at different time periods (2 or 12 h) were labled with ∗∗ (P < 0.01), and ∗∗∗ (P < 0.001). Data represent the mean ± SEM of triplicate experiments.

Similar articles

Cited by

References

    1. Alberti S., Alvarez D., Merino S., Casado M. T., Vivanco F., Tomas J. M., et al. (1996). Analysis of complement C3 deposition and degradation on Klebsiella pneumoniae. Infect. Immun. 64 4726–4732. - PMC - PubMed
    1. Alvarez D., Merino S., Tomas J. M., Benedi V. J., Alberti S. (2000). Capsular polysaccharide is a major complement resistance factor in lipopolysaccharide O side chain-deficient Klebsiella pneumoniae clinical isolates. Infect. Immun. 68 953–955. 10.1128/iai.68.2.953-955.2000 - DOI - PMC - PubMed
    1. Cai R., Wu M., Zhang H., Zhang Y., Cheng M., Guo Z., et al. (2018). A smooth-type, phage-resistant Klebsiella pneumoniae mutant strain reveals OmpC is indispensable for GH-K3 infection. Appl. Environ. Microbiol. 84:e1585–18. 10.1128/AEM.01585-18 - DOI - PMC - PubMed
    1. Cano V., Moranta D., Llobet-Brossa E., Bengoechea J. A., Garmendia J. (2009). Klebsiella pneumoniae triggers a cytotoxic effect on airway epithelial cells. BMC Microbiol. 9:156. 10.1186/1471-2180-9-156 - DOI - PMC - PubMed
    1. Cheng H. Y., Chen Y. S., Wu C. Y., Chang H. Y., Lai Y. C., Peng H. L. (2010). RmpA regulation of capsular polysaccharide biosynthesis in Klebsiella pneumoniae CG43. J. Bacteriol. 192 3144–3158. 10.1128/JB.00031-10 - DOI - PMC - PubMed