. 2019 May 28:10:1148.
doi: 10.3389/fimmu.2019.01148. eCollection 2019.

Comprehensive Characterization of a Next-Generation Antiviral T-Cell Product and Feasibility for Application in Immunosuppressed Transplant Patients

Affiliations

Comprehensive Characterization of a Next-Generation Antiviral T-Cell Product and Feasibility for Application in Immunosuppressed Transplant Patients

Leila Amini et al. Front Immunol. .

Abstract

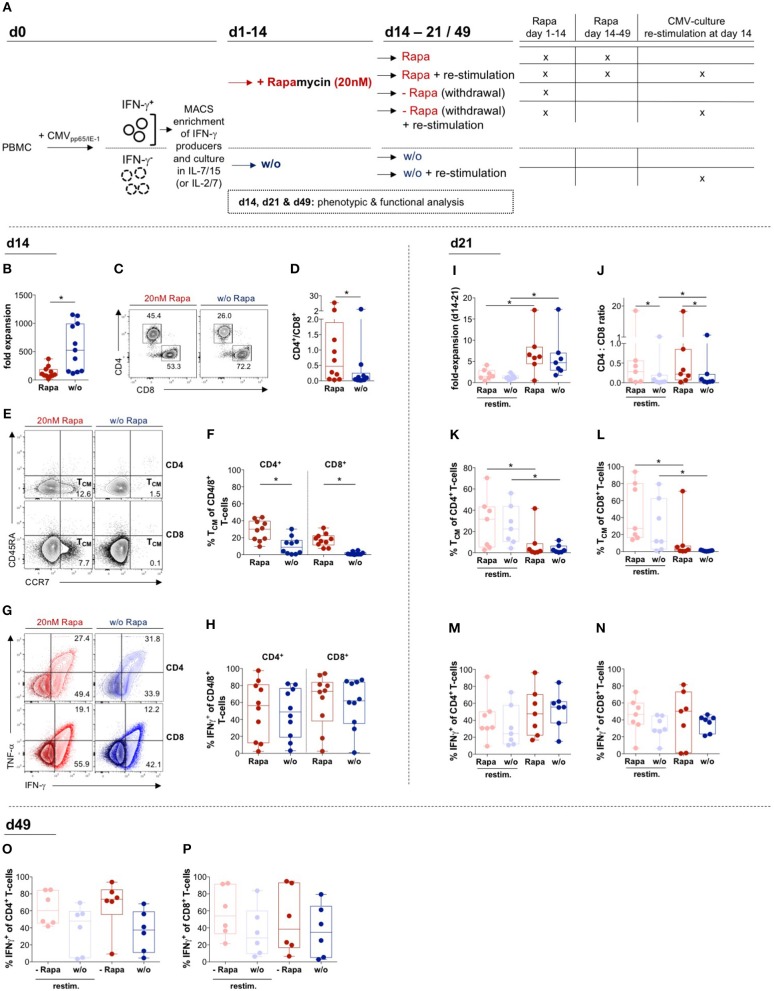
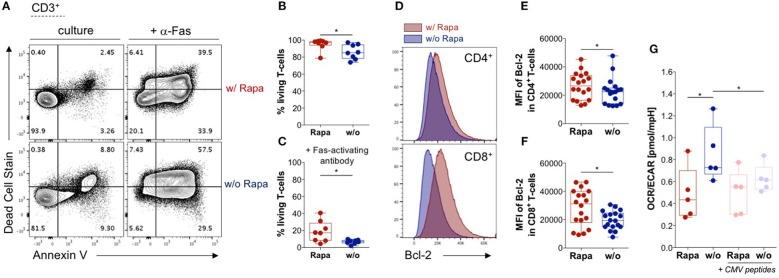
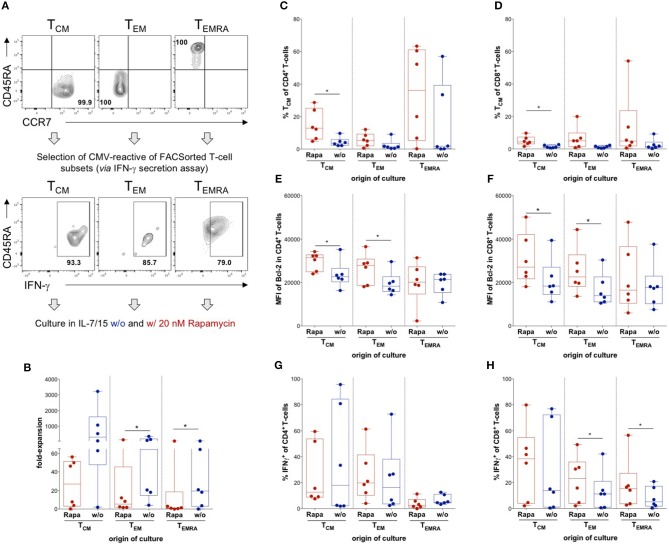
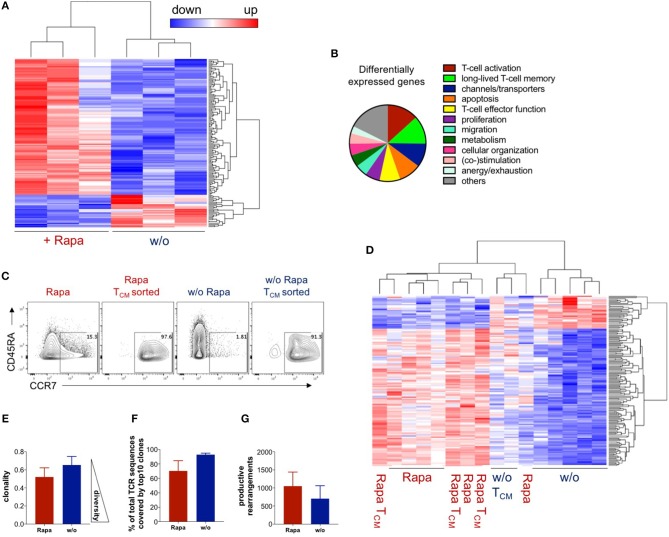
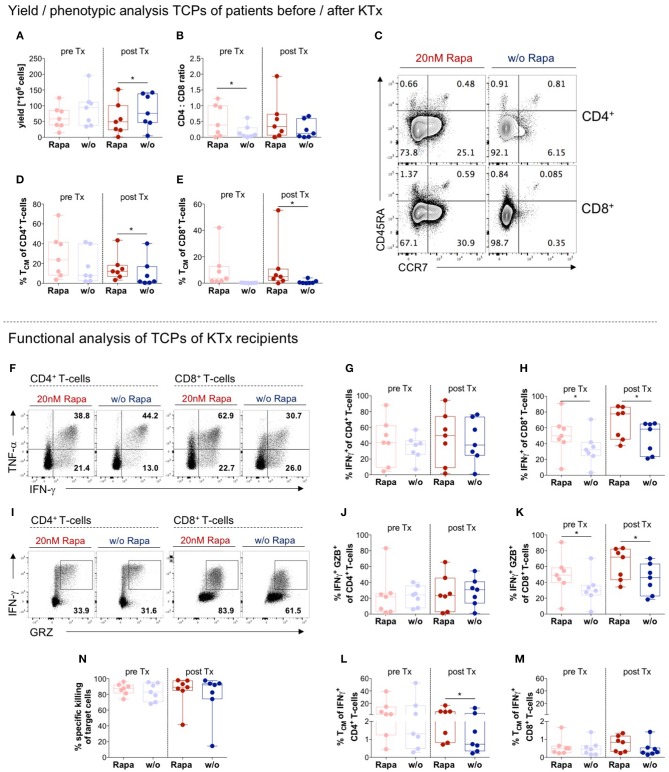
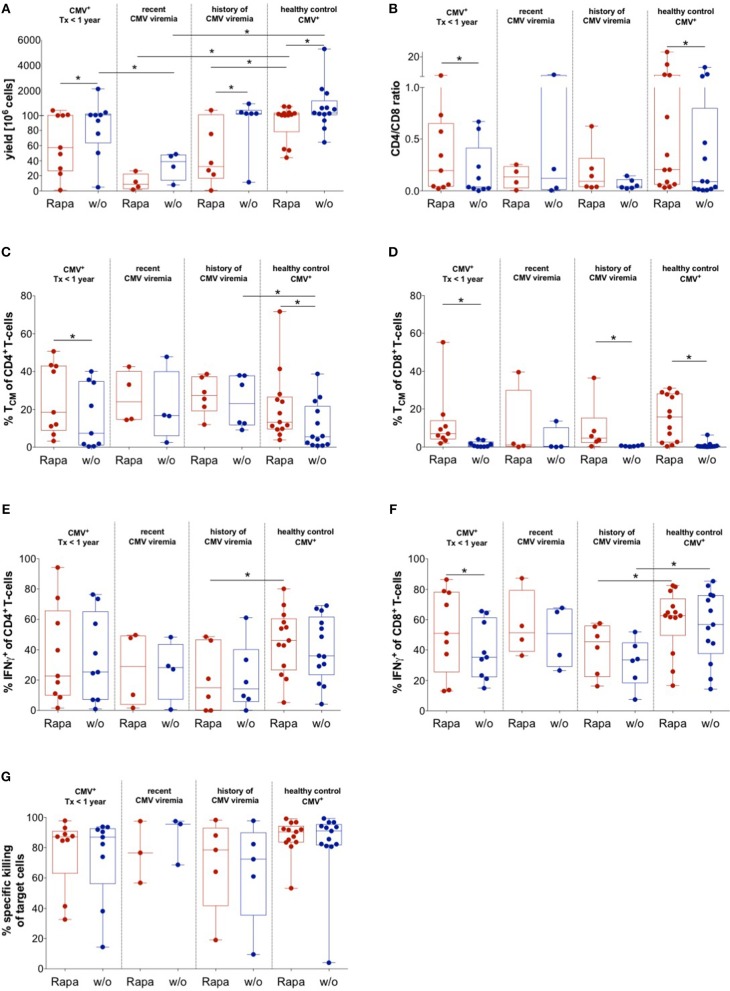
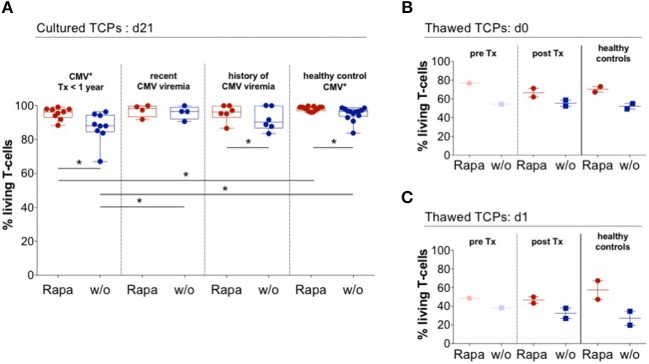
Viral infections have a major impact on morbidity and mortality of immunosuppressed solid organ transplant (SOT) patients because of missing or failure of adequate pharmacologic antiviral treatment. Adoptive antiviral T-cell therapy (AVTT), regenerating disturbed endogenous T-cell immunity, emerged as an attractive alternative approach to combat severe viral complications in immunocompromised patients. AVTT is successful in patients after hematopoietic stem cell transplantation where T-cell products (TCPs) are manufactured from healthy donors. In contrast, in the SOT setting TCPs are derived from/applied back to immunosuppressed patients. We and others demonstrated feasibility of TCP generation from SOT patients and first clinical proof-of-concept trials revealing promising data. However, the initial efficacy is frequently lost long-term, because of limited survival of transferred short-lived T-cells indicating a need for next-generation TCPs. Our recent data suggest that Rapamycin treatment during TCP manufacture, conferring partial inhibition of mTOR, might improve its composition. The aim of this study was to confirm these promising observations in a setting closer to clinical challenges and to deeply characterize the next-generation TCPs. Using cytomegalovirus (CMV) as model, our next-generation Rapamycin-treated (Rapa-)TCP showed consistently increased proportions of CD4+ T-cells as well as CD4+ and CD8+ central-memory T-cells (TCM). In addition, Rapamycin sustained T-cell function despite withdrawal of Rapamycin, showed superior T-cell viability and resistance to apoptosis, stable metabolism upon activation, preferential expansion of TCM, partial conversion of other memory T-cell subsets to TCM and increased clonal diversity. On transcriptome level, we observed a gene expression profile denoting long-lived early memory T-cells with potent effector functions. Furthermore, we successfully applied the novel protocol for the generation of Rapa-TCPs to 19/19 SOT patients in a comparative study, irrespective of their history of CMV reactivation. Moreover, comparison of paired TCPs generated before/after transplantation did not reveal inferiority of the latter despite exposition to maintenance immunosuppression post-SOT. Our data imply that the Rapa-TCPs, exhibiting longevity and sustained T-cell memory, are a reasonable treatment option for SOT patients. Based on our success to manufacture Rapa-TCPs from SOT patients under maintenance immunosuppression, now, we seek ultimate clinical proof of efficacy in a clinical study.

Keywords: Rapamycin; adoptive T-cell therapy; cytomegalovirus; immune regeneration; mTOR; solid organ transplantation.


Figures

Figure 1
Figure 1
Effects of Rapamycin on T-cell products: Expansion, phenotype and function. (A) Schematic overview of experiments: T-cell products (TCPs) were generated from PBMCs isolated from venous blood of healthy donors (HDs) by magnetically activated cell sorting (MACS) of T-cells producing IFNγ in response to stimulation with CMVIE−1/pp65 peptide pools and expanded in the presence of either IL-2/IL-7 (Figure S1) or IL-7/IL-15 without (w/o; blue) or with addition of 20 nMof Rapamycin (Rapa; red) (B–P). Parts of the culture were re-stimulated using thawed CD3 PBMCs loaded with CMVIE−1/pp65 peptide pools, deprived of Rapamycin or a combination of both on d14. (B) Expansion rates of IL-7/15-expanded Rapa-treated (Rapa-)TCPs (red) and untreated TCPs (blue) of n = 10 healthy donors (HDs) calculated from yield at d14 divided by the number of seeded cells at d0. We gated flow cytometric data on lymphocytes singlets living CD3+ T-cells. (C) Exemplary flow cytometry plots of CD4+ and CD8+ populations among living CD3+ T-cells in the Rapa-TCP (left plot) and untreated TCP (w/o, right plot) of one HD. (D) CD4/CD8 ratios in Rapa- (red) and untreated TCPs (blue) of n = 10 HDs calculated from flow cytometry data as presented in (C). (E) Gating strategy for CD45RA CCR7+ central memory T-cells (TCM) among CD4+ (upper panel) and CD8+ (lower panel) in Rapa- (left panel) and untreated TCPs (right panel) of one exemplary HD. (F) Proportions of CD4+ and CD8+ TCM among Rapa- (red) and untreated TCPs (blue) of n = 10 HDs determined from flow cytometric data as shown in (E) at d14. (G,H) To detect CMV-specific cytokine producers, TCPs were stimulated with CMVIE−1/pp65 peptide-loaded autologous lymphoblastic cell lines (LCLs) at a ratio of 1:10 for 6 h and Brefeldin A (BFA) was added after 1 h. (G) Representative flow cytometric plots of IFNγ- and TNFα-producers in Rapa- (left panel, red) and untreated TCPs (right panel, blue) of one HD. The dark population represents unstimulated and the light population illustrates CMVIE−1/pp65-stimulated CD4+ (upper panel) and CD8+ T-cells (lower panel). (H) Proportions of CMV-specific IFNγ-producers among CD4+ and CD8+ T-cells in Rapa- (red) and untreated TCPs (blue) of n = 10 HDs determined from flow cytometric data as shown in (G) at d14. (I–N): For re-stimulation on d14 of culture, thawed CD3 autologous PBMCs were loaded with CMVIE−1/pp65 peptide pools and added at 1:5 ratio to T-cells. (I) Expansion rates of IL-7/15-expanded re-stimulated (pastel colors) or non-re-stimulated (dark colors) Rapa- (red) and untreated TCPs (blue) of n = 7 HDs calculated from yield at d21 divided by the number of cells at d14. (J) CD4/CD8 ratios in Rapa- (red) and untreated TCPs (blue) of n = 7 HDs calculated from flow cytometric data as presented in (C) at d21. (K,L): Proportions of CD4+ (K) and CD8+ TCM (L) among Rapa- (red) and untreated TCPs (blue) of n = 7 HDs determined from flow cytometric data as shown in (E) at d21. (M–P) To detect CMV-specific cytokine producers, TCPs were stimulated with CMVIE−1/pp65 peptide-loaded autologous LCLs for 6 h and BFA was added after 1 h. (M–N) Proportions of CMV-specific IFNγ-producers among CD4+ (M) and CD8+ T-cells (N) in Rapa- (red) and untreated TCPs (blue) of n = 7 HDs determined from flow cytometric data as shown in (G) at d21. (O,P) To mimic the situation after infusion, Rapa was withdrawn and TCPs were cultivated long-term until d49. Proportions of CMV-specific IFNγ-producers among CD4+ (O) and CD8+ T-cells (P) in TCPs withdrawn from Rapa (red) and untreated TCPs (blue) of n = 6 HDs determined from flow cytometric data as shown in (G) at d49. For all graphs normal distribution of data points was tested with Kolmogorov-Smirnov test and paired t-test was used to determine significance in normally distributed samples or Wilcoxon's matched-pairs signed rank test in not normally distributed samples, respectively. P-values below 0.05 are indicated by * and defined to be significant.
Figure 2
Figure 2
Rapamycin promotes survival of T-cells and stabilizes their metabolism. (A) Exemplary dot-plots of flow cytometry data regarding live/dead stain and Annexin V stain (apoptosis) gated on lymphocytes singlets CD3+ T-cells. Living T-cells are defined by double negative staining for Annexin V and live/dead stain in Rapa- (upper panel) and untreated TCPs (lower panel). Samples in the right panel were treated with 1 μg/ml activating antibody against Fas (CD95) to induce apoptosis. (B) Proportions of living T-cells in Rapa- (red) and untreated TCPs (blue) of n = 8 HDs identified as shown in (A) at d21. (C) Proportions of living T-cells in Rapa- (red) and untreated TCPs (blue) of n = 8 HDs incubated with Fas-activating antibody identified as shown in (A) at d21. (D) Exemplary histograms of fluorescence intensity of Bcl-2 in CD4+ (upper panel) and CD8+ T-cells (lower panel) of untreated (blue) and Rapa-TCPs (red) acquired by flow cytometry. (E,F) MFIs of Bcl-2 in CD4+ (E) and CD8+ T-cells (F) in untreated (blue) and Rapa-TCPs (red) of n = 18 HDs. (G) Oxygen consumption rare (OCR)/extracellular acidification rate (ECAR) ratio of Rapa- (red) and untreated TCPs (blue) of n = 5 HDs determined in a Seahorse assay. For stimulation (pastel colors) CMVIE−1/pp65 peptide pools were added to TCPs relying on mutual presentation of peptides by T-cells from the TCP. For all graphs normal distribution of data points was tested with Kolmogorov-Smirnov test and paired t-test was used to determine significance. P-values below 0.05 are indicated by * and defined to be significant.
Figure 3
Figure 3
Influence of Rapamycin on different T-cell memory subsets. (A) Schematic experimental setup: TCM, TEM, and TEMRA were sorted out of lymphocytes singlets CD3+ T-cells according to expression of CCR7 and CD45RA, CMV-reactive T-cells were isolated from each subset using an IFNγ secretion assay and CMV-reactive T-cells from each subset were cultured with (Rapa) and without Rapamycin (w/o). Exemplary dot plots of flow cytometry data of sorted subsets of one HD and respective positive fractions of the IFNγ secretion assay are shown. (B) Expansion rates of the indicated subsets in the presence of (red, Rapa) and absence of Rapamycin (blue, w/o) calculated from total cell numbers at d21 divided by the seeded cell number. (C,D) Proportions of CD4+ (C) and CD8+ CD45RA CCR7+ TCM-like cells (D) among Rapa-treated (red) and untreated (blue) cultures of indicated subsets determined from flow cytometric data at d21. (E,F) MFIs of Bcl-2 in CD4+ (E) and CD8+ T-cells (F) in untreated (blue) and Rapa-treated cultures (red) of isolated T-cell subsets determined in flow cytometry. (G,H) To detect CMV-specific cytokine production, cultures were stimulated with CMVIE−1/pp65 peptide-loaded autologous LCLs at a ratio of 1:10 for 6 h and BFA was added after 1 h. Proportions of CMV-specific IFNγ-producers among CD4+ (G) and CD8+ T-cells (H) in Rapa-treated (red) and untreated (blue) cultures of isolated T-cell subsets determined from flow cytometric data. All graphs contain data from n = 6 HDs, normal distribution of data points was tested with Kolmogorov-Smirnov test and paired t-test was used to determine significance in normally distributed samples or Wilcoxon's matched-pairs signed rank test in not normally distributed samples, respectively. P-values below 0.05 are indicated by * and defined to be significant.
Figure 4
Figure 4
Rapamycin-treated TCPs have a unique transcriptome resembling TCM and are clonally more diverse. RNA expression data were acquired by RNA sequencing and samples had to pass a quality control to be included in the analysis. (A) Expression heat map of differentially expressed genes between untreated and Rapa-TCPs generated from fresh blood of n = 3 HDs at d21. (B) Processes allocated to the differentially expressed genes based on the literature (see Table S1 for details). (C) Exemplary dot plots of CCR7/CD45RA expression of untreated and Rapa-TCPs and the respective TCM-like cells sorted on d18 of culture. (D) Expression of differentially expressed genes between Rapa- and untreated TCPs from fresh blood of n = 3 HDs at d21, buffy coats of n = 3 HDs at d18 and TCM sorted from Rapa- and untreated TCPs generated from buffy coats of the same n = 3 HDs at d18 including clustering. Samples not included in the graph were discarded due to failure at the quality threshold. (E) Clonality of Rapa- (red) and untreated TCPs (blue) n = 3. (F) Proportions of represented sequences covered by the top 10 most represented clones in Rapa- (red) and untreated TCPs (blue), n = 3 HDs. (G) Numbers of productive rearrangements included in in Rapa- (red) and untreated TCPs (blue), n = 3 HDs. Data in (E,F) were calculated with ImmunoSEQ-Analyzer3.0 software based on TCRβ sequencing.
Figure 5
Figure 5
Manufacture of Rapa-TCPs is feasible before/after transplantation. N = 7 paired samples of untreated (w/o, blue) and Rapa-TCPs (red) from the same patients before (pre; pastel colors) and a few weeks after KTx (post). (A) Yield of TCPs = total cell number derived from 20 ml of patient blood on d21. (B) CD4/CD8 ratio of TCPs determined by multicolor flow cytometry on d14. (C) Exemplary dot plots of one patient's untreated (right) and Rapa-TCPs (left) comparing subset distributions of CD3+CD4+ (upper panel) and CD3+CD8+ (lower panel) T-cells according to CCR7 and CD45RA expression on d14. (D,E) Proportions of CD45RA CCR7 + TCM among CD4+ (D) and CD8+ T-cells (E) in TCPs on d14 as determined per gating strategy shown in (C). (F) Exemplary dot plots of one patient comparing CD3+CD4+ (left panel) and CD3+CD8+(right panel) IFNγ- and TNFα-producers in Rapa- (red) and untreated TCPs (blue) detected by intracellular staining in multicolor flow cytometry after 6 h stimulation with autologous LCLs loaded with CMVIE−1/pp65 peptide pools (gray) or incubation with unloaded autologous LCLs as control (black) and addition of BFA after 1 h on d21. (G,H) Summary of background subtracted proportions of CD4+ (G) and CD8+ (H) CMV-reactive IFNγ-producing T-cells in Rapa- (red) and untreated TCPs (blue) gated as illustrated in (F). (I) Exemplary dot plots of one donor comparing CD4+ (left panel) and CD8+ (right panel) CMV-reactive IFNγ- and GZB-producers in Rapa- (red) and untreated TCPs (blue) detected by intracellular staining in multicolor flow cytometry after 6 h stimulation with autologous LCLs loaded CMVIE−1 and CMVpp65 peptide pools (gray), incubation with unloaded autologous LCLs as control (black) and addition of BFA after 1 h on d21. (J,K) Summary of background subtracted proportions of CD4+ (J) and CD8+ (K) CMV-reactive IFNγ/GZB-double-producers in Rapa- (red) and untreated TCPs (blue) gated as illustrated in (I). (L,M) Proportions of CD45RA CCR7 + TCM among CMV-reactive IFNγ-producing CD4+ (L) and CD8+ T-cells (M). Gates were applied from gates set for global T-cell subset distribution (see Figure S4). (N) Specific killing of CMVIE−1/pp65 peptide pool loaded autologous LCLs determined by ratio with unloaded allogenic LCLs at a 1:10 ratio with TCPs after incubation overnight. All data tested for normal distribution of data points with Kolmogorov-Smirnov test; significance determined with paired t-test if normally distributed or Wilcoxon's matched-pairs signed rank test for not normally distributed samples. P-values below 0.05 are indicated by * and defined to be significant.
Figure 6
Figure 6
Impact of CMV history on manufacture of untreated and Rapa-TCPs. Untreated (w/o, blue) and Rapa-TCPs (red) of n = 19 patients (9 with so far no recorded CMV viremia; 4 with recent CMV viremia and 6 with a history of CMV viremia)/13 HDs. (A) Yield of TCPs = total cell number derived from 20 ml of patient blood on d21. (B) CD4/CD8 ratio of TCPs on d14. (C,D) Proportions of CD45RA CCR7 + TCM among CD4+ (C) and CD8+ T-cells (D) in TCPs as determined per gating strategy shown in Figure 5C on d14. (E,F) Proportions of CMV-reactive CD4+ (E) and CD8+ (F) IFNγ-producers detected by intracellular staining in multicolor flow cytometry after 6 h stimulation with autologous LCLs loaded CMVIE−1/pp65 peptide pools at a ratio of 1:10 and addition of BFA after 1 h on d21. Gating strategy is shown in Figure 5F. (G) Specific killing of CMVIE−1/pp65 peptide pool loaded autologous LCLs determined by ratio with unloaded allogenic LCLs at 1:10 ratio with TCPs after incubation overnight. All data were tested for normality with Kolmogorov-Smirnov test; significant differences for paired samples determined with paired t-test if normally distributed or Wilcoxon's matched-pairs signed rank test and for unpaired samples with unpaired t-test if normally distributed or Man Whitney's test. P-values below 0.05 are indicated by * and defined to be significant.
Figure 7
Figure 7
Rapa-TCPs from patients exhibit superior viability before and after thawing. Untreated (w/o, blue) and Rapa-TCPs (red) of n = 19 patients (9 with so far no recorded CMV viremia; 4 with recent CMV viremia and 6 with a history of CMV viremia)/13 HDs. (A) Proportions of living T-cells determined by positive staining for CD3 and negative staining for live/dead stain and Annexin V. (B,C) Untreated (w/o, blue) and Rapa-TCPs (red) from n = 4 (paired pre- and post-KTx samples of patient no. 11; post-KTx TCPs of patient no. 9 and two HDs). TCPs were frozen in fetal calf serum substituted with 10 % dimethylsulfoxide and stored in liquid nitrogen. After thawing and two washing steps, proportions of living T-cells defined by positive staining for CD3 and negative staining for live/dead stain and Annexin V were determined immediately (d0, B) and after 24 h rest in complete medium in a humidified incubator at 37°C and 5% CO2 (d1, C). All data were tested for normality with Kolmogorov-Smirnov test; significant differences for paired samples determined with paired t test if normally distributed or Wilcoxon's matched-pairs signed rank test and for unpaired samples with unpaired t test if normally distributed or Man Whitney's test. P-values below 0.05 are indicated by * and defined to be significant.

Similar articles

Cited by

References

    1. Harvala H, Stewart C, Muller K, Burns S, Marson L, MacGilchrist A, et al. . High risk of cytomegalovirus infection following solid organ transplantation despite prophylactic therapy. J Med Virol. (2013) 85:893–8. 10.1002/jmv.23539 - DOI - PubMed
    1. Tong CY, Bakran A, Peiris JS, Muir P, Herrington CS. The association of viral infection and chronic allograft nephropathy with graft dysfunction after renal transplantation. Transplantation. (2002) 74:576–8. 10.1097/00007890-200208270-00026 - DOI - PubMed
    1. Bonatti H, Sifri CD, Larcher C, Schneeberger S, Kotton C, Geltner C. Use of cidofovir for cytomegalovirus disease refractory to ganciclovir in solid organ recipients. Surg Infect. (2017) 18:128–36. 10.1089/sur.2015.266 - DOI - PubMed
    1. Grossi PA, Costa AN, Fehily D, Blumberg EA, Kuehnert MJ, Fishman JA, et al. . Infections and organ transplantation: new challenges for prevention and treatment–a colloquium. Transplantation. (2012) 93:S4–39. 10.1097/TP.0b013e3182481347 - DOI - PubMed
    1. Kumar D, Chernenko S, Moussa G, Cobos I, Manuel O, Preiksaitis J, et al. . Cell-mediated immunity to predict cytomegalovirus disease in high-risk solid organ transplant recipients. Am J Transplant. (2009) 9:1214–22. 10.1111/j.1600-6143.2009.02618.x - DOI - PubMed

Publication types

MeSH terms