. 2019 May 29:10:1195.
doi: 10.3389/fimmu.2019.01195. eCollection 2019.

Novel Targeting to XCR1+ Dendritic Cells Using Allogeneic T Cells for Polytopical Antibody Responses in the Lymph Nodes

Affiliations

Novel Targeting to XCR1+ Dendritic Cells Using Allogeneic T Cells for Polytopical Antibody Responses in the Lymph Nodes

Yusuke Kitazawa et al. Front Immunol. .

Abstract

Vaccination strategy that induce efficient antibody responses polytopically in most lymph nodes (LNs) against infections has not been established yet. Because donor-specific blood transfusion induces anti-donor class I MHC antibody production in splenectomized rats, we examined the mechanism and significance of this response. Among the donor blood components, T cells were the most efficient immunogens, inducing recipient T cell and B cell proliferative responses not only in the spleen, but also in the peripheral and gut LNs. Donor T cells soon migrated to the splenic T cell area and the LNs, with a temporary significant increase in recipient NK cells. XCR1+ resident dendritic cells (DCs), but not XCR1- DCs, selectively phagocytosed donor class I MHC+ fragments after 1 day. After 1.5 days, both DC subsets formed clusters with recipient CD4+ T cells, which proliferated within these clusters. Inhibition of donor T cell migration or depletion of NK cells by pretreatment with pertussis toxin or anti-asialoGM1 antibody, respectively, significantly suppressed DC phagocytosis and subsequent immune responses. Three allogeneic strains with different NK activities had the same response but with different intensity. Donor T cell proliferation was not required, indicating that the graft vs. host reaction is dispensable. Intravenous transfer of antigen-labeled and mitotic inhibitor-treated allogeneic, but not syngeneic, T cells induced a polytopical antibody response to labeled antigens in the LNs of splenectomized rats. These results demonstrate a novel mechanism of alloresponses polytopically in the secondary lymphoid organs (SLOs) induced by allogeneic T cells. Donor T cells behave as self-migratory antigen ferries to be delivered to resident XCR1+ DCs with negligible commitment of migratory DCs. Allogeneic T cells may be clinically applicable as vaccine vectors for polytopical prophylactic antibody production even in asplenic or hyposplenic individuals.

Keywords: XCR1+ dendritic cell; allogeneic T cell; asplenia; dendritic cell targeting; lymph nodes; polytopical antibody production; vaccination.


Figures
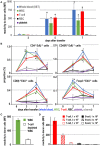
Figure 1
Figure 1
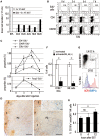
Screening of effective blood components for the donor-specific transfusion (DST) response. (A) Production of DST antibodies in recipient blood after donor blood component injection. In the white blood cell (WBC) and T cell injected groups, DST antibodies were detected after 5 days (mean ± SD, n = 3 rats each, *P < 0.05). (B) The time kinetic changes in each proliferating cell type as a proportion of total splenocytes. Two-color FCM analysis of recipient splenic lymphocytes after donor blood component injection for proliferating cells (EdU+) and CD4+ T cells, CD8β+ T cells, CD45R+ B cells, or regulatory T cells (Foxp3+). The proliferation of CD4+ T cells and regulatory T cells peaked 3 days after treatment, whereas B cells and CD8β+ T cells peaked at 5 days. These results were similar to the DST group that received whole blood (mean ± SD, n = 3 rats each, *P < 0.05). (C) With T cell depletion of WBCs, the DST antibody production was suppressed at 7 days. (D) Dose-dependent response following injection of isolated T cells or B cells. T cells induced much higher DST antibody production than B cells (mean ± SD, n = 3 rats each, *P < 0.05). MFI, mean fluorescent intensity.
Figure 2
Figure 2
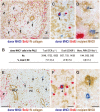
Fate of donor T cells after DST. Three-color immunostaining of recipient spleens (A–D) or peripheral LNs (E–G) for donor MHCI (blue), BrdU (red), and type IV collagen (brown) or recipient MHCII (brown). (A,E) Donor MHCI+ cells (arrows) were observed in the PALS (A) and T cell area of the LNs (paracortex, PC) (E) at day 1. (B) Phenotype of donor MHCI+ cells and cell ratio in the PALS. Approximately 100 donor MHCI+ cells/rat were examined (n = 3). Donor MHCI+ cells that migrated to the PALS were TCRαβ+ T cells (~70%) and CD45R+ B cells (~30%). (C,F) A donor cell binding to MHCII+ putative recipient DCs (brown) became BrdU+ (arrowhead) in the PALS (C) and the PC (F) at day 1, representing a graft vs. host reaction. (D,G) Donor MHCI+ fragments (blue) superimposed on the cytoplasm of recipient putative DCs (arrows) in the PALS (D) and the PC (G) at day 2, suggesting phagocytosis. F, lymph follicle; P, splenic PALS; Z, marginal zone; HEV, high endothelial venule. Scale bar = 100 μm (A,E), 20 μm (C,F), or 10 μm (D,G).
Figure 3
Figure 3
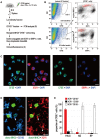
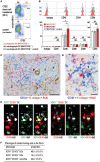
Phagocytosis of donor MHCI fragments and phenotype of phagocytic DCs in the spleen. (A) Experimental protocol for identifying DCs that phagocytosed donor cells. (B) Three-color FCM analysis of magnetically isolated CD103+ DC fraction of the recipient spleen 36 h after CFSE-labeled thoracic duct lymphocyte (TDL) injection for CFSE, XCR1, or SIRP1α, and recipient MHCII. XCR1+SIRP1αCD103+MHCIIhigh DCs expressing CFSE+ signals (red dots) were detected within the gated fraction (1.05%) of the SSC vs. CFSE plot. A representative data of 4 individual experiments. (C) Two-color immunofluorescent staining of cytosmears of sorted CD103+recipient MHCIIhighCFSE+ cells for DAPI (DNA stain, blue), and XCRI or SIRP1α (red). CFSE+ donor cell fragments (green) were observed in the cytoplasm of XCR1+SIRP1α DCs but not XCR1SIRP1α+ DCs, indicating phagocytosis. Scale bar = 10 μm. (D) Three-color immunofluorescent staining of the PALS cryosections for donor MHCI (green), CD103 (blue), and XCR1 (red). The arrowheads indicate XCR1+CD103+ DCs with phagocytosed donor MHCI+ fragments. Scale bar = 10 μm. (E) The subset and ratio of CFSE+ phagocytic cells in different splenic areas. In the PALS, XCR1+CD103+ DCs accounted for more than 80% in CFSE+ phagocytic cells (mean ± SD, n = 4 rats each). In contrast, more than 90% phagocytic cells in the marginal zone (MZ) and red pulp (RP) were XCR1+CD103 non-DCs.
Figure 4
Figure 4
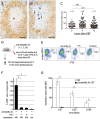
Kinetics of NK cells and donor cell phagocytosis in the PALS. Double immunostaining for asialo GM1 (blue) and rat IgM (brown) in the splenic PALS 0 (A) and 4 h (B) after donor-specific transfusion (DST). Arrows indicate asialo GM1+ NK cells. (P, splenic PALS. Scale bar = 100 μm. (C) Number of asialo GM1+ NK cells/mm2 of PALS 0, 4, and 12 h after DST. NK cells significantly increased in the PALS 4 h after DST. Data was analyzed by Mann-Whitney U-test. (D) Experimental protocol for examining the effect of NK cell depletion by anti-asialo GM1 antibody (Ab) on the DST response. PTX, pertussis toxin. (E,F) With NK cell depletion, DCs ingesting CFSE+ donor T cell fragments in the spleen significantly decreased in number to the same level of the syngeneic combination group. PTX pretreatment of donor T cells also resulted in the significant decrease. mean ± SD, n = 3 rats each, *P < 0.05. allo, allogeneic ACI to Lewis; syn, syngeneic Lewis to Lewis. (G) In the NK cell-depleted group, the DST antibody response disappeared completely (mean ± SD, n = 3 rats each, *P < 0.05). MFI, mean fluorescent intensity.
Figure 5
Figure 5
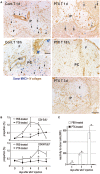
Requirement of T cell migration to the PALS for induction of the DST response. (A) Two-color immunostaining for donor MHCI (blue) and type IV collagen (brown) in the spleen at 1 and 3 days after 2 × 10⁶ donor T cell injection and in the peripheral LNs at 18 h after 2 × 10⁷ donor T cell injection. The control group exhibited migration to the PALS by 1 day (Cont T 1d, arrowheads) and LNs by 18 h (Cont T 18 h, arrowheads). In contrast, pertussis toxin (PTX) pretreated donor T cells did not enter the PALS up to 3 days (PTX T 3d), but stayed in the marginal zone and red pulp for 1 day (PTX T 1d, arrows). They did not enter the LNs (PTX T 18 h) either. F, lymph follicle; HEV, high endothelial venule; P, PALS; PC, paracortex. Scale bar = 100 μm or 20 μm (inset). (B,C) With PTX pretreatment of donor T cells, the DST responses of CD4+ T cells and CD45R+ B cells (B) and serum antibodies (C) were abrogated (mean ± SD, n = 3 rats each, *P < 0.05). MFI, mean fluorescent intensity.
Figure 6
Figure 6
Induction of the donor-specific transfusion (DST) response in the LNs of splenectomized (A–C,F,G) or eusplenic (D,E) recipients. The recipient peripheral LNs were analyzed in the same manner as the spleen (Figure 1, 3, 4). (A) Two-color FCM analysis of the number of migrated donor T cells in recipient LNs 24 h after injection. Roughly twice as many donor T cells migrated to the LNs than in the eusplenic control. SPL, spleen; CLN, cervical LN; BLN, brachial LN; ALN, axillary LN; HLN, hepatic LN; MLN, mesenteric LN. (B,C) The time kinetic changes in each proliferating cell type/total LN cells by FCM analysis. The CD4+ T cells and regulatory T cells peaked at 3–5 days and 3 days, respectively, whereas CD45R+ B cells and CD8β+ T cells peaked at 5 days (mean ± SD, n = 3 rats each, *P < 0.05). (D,E) Kinetics of NK cells in the peripheral LNs after DST. (D) Double immunostaining of the LNs for asialo GM1 (blue) and rat IgM (brown) at 0 (left panel) and 12 h (right panel). Inset indicates increased asialo GM1+ NK cells (blue) in the paracortex (PC). Scale bar = 200 μm or 50 μm (inset). F, lymph follicle. (E) The proportion of NK cells significantly increased in the LNs at 12 h (mean ± SD, n = 3 rats each, *P < 0.05). (F) Kinetics of donor cell phagocytosis in the peripheral LNs after donor T cell injection. Phagocytosis of donor cell fragments by DCs was detected 36 h after transfer of 2 × 10⁷ CFSE labeled T cells. With anti-asialo GM1 antibody (Ab) treatment, the numbers of recipient CFSE+ phagocytic DCs and NK cells were significantly reduced compared to non-treated control (mean ± SD, n = 3 rats each, *P < 0.05). (G) Phenotype of CFSE+ phagocytic DCs in the peripheral LNs. Note that they were XCR1+SIRP1α, similar as those of spleen.
Figure 7
Figure 7
Activation state of phagocytic dendritic cells (DCs) and phenotype of DCs that cluster with proliferating cells in the PALS. (A,B) Upregulation of CD40 in XCR1+ DCs following phagocytosis. Phagocytic DCs were compared with non-phagocytic DCs in MHCIIhigh gates with/without donor cell transfer (mean ± SD, n = 4 rats each, *P < 0.05, NS, not significant). (C,D) Three-color immunostaining of the spleen 2 days after DST for CD103 (blue), BrdU (red), and type IV collagen (brown). (C) Many CD103+ DCs (blue) and BrdU+ proliferating cells (red) are present in the PALS (P). Scale bar = 100 μm. F, lymph follicle; Z, marginal zone. (D) Inset of A showing cluster formation (arrowheads) of recipient DCs (blue) with BrdU+ cells (red). Scale bar = 20 μm. (E) Three-color immunofluorescence staining of the PALS for XCR1 (green), CD103 (red), and EdU (white) 2 days after DST, showing clusters (arrowheads) of XCR1+CD103+ (left panels) or XCR1CD103+ (right panels) DCs with EdU+ proliferating cells (white). Scale bar = 10 μm. (F) Proportion of cluster-forming cells in the PALS, showing ~50, ~15, and ~35% were XCR1+CD103+ DCs, XCR1CD103+ DCs, and XCR1+CD103 non-DCs, respectively (mean ± SD, n = 3 rats each, *P < 0.05).
Figure 8
Figure 8
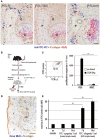
Antigen-labeled donor T cells induce specific antibody production. (A) Three-color immunostaining of recipient spleen for anti-FITC antibody (blue), type IV collagen (brown), and BrdU (red). FITC-T cells induced specific anti-FITC antibody forming cell response (blue) in the outer margin of the PALS (O) at 7 days after injection [FITC-T]. When FITC-streptavidin was omitted for background staining, anti-FITC antibody was not detected [FITC-T BG]. Positive control staining for anti-FITC antibody forming cells 5 days after i.v. injection of FITC-labeled KLH [FITC-KLH]. G, germinal center; P, PALS. Scale bar = 100 μm. (B) Experimental protocol for inducing antibody production in LNs with FITC-labeled donor T cells. (C) Effect of mitomycin C (MMC) on FITC-labeled donor T cell proliferation. Purity of FITC-labeled donor T cells was 94% by FCM. The proliferation of MMC-treated T cells induced by CD28 superagonist (SAg) was abrogated compared to intense proliferation in PBS-treated control. (D) Two-color immunostaining for donor MHCI (blue) and type IV collagen (brown) in the LNs 1 d after injection of MMC-treated FITC-labeled donor T cells. They readily migrated to the T cell area of the LNs (paracortex, PC). F, lymphoid follicle; HEV, high endothelial venule. Scale bar = 100 μm. (E) MMC-treated FITC-labeled allogeneic, but not syngeneic, T cells induced a low, but significant, antibody response to FITC. (C,E) mean ± SD, n = 3 rats each, *P < 0.05. MFI, mean fluorescent intensity.
Figure 9
Figure 9
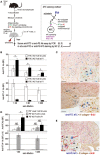
Antibody production to labeled antigens without DST antibodies in F1 rats that received parental T cells. (A) Experimental protocol for detecting specific antibody production in sera and the LNs. T cells were labeled either with FITC directly or with PE-conjugated ant-rat CD4 mAb. AFC, antibody-forming cells. (B,D) Antibody responses in parental ACI (RT1.AaBa) to (Lewis × ACI)F1 hybrid rat (RT1.AalBal) combination concerning anti-donor MHCI, anti-FITC (B), and anti-PE (D) antibodies in recipient sera. Both anti-FITC and anti-PE antibodies of parental to F1 rat combination had considerably higher titers than those of the allogeneic control. In contrast, DST (anti-RT1.Aa) antibodies were negligible, whereas, allogeneic control induced an intense level of DST antibodies (mean ± SD, n = 3 rats each, *P < 0.05). MFI, mean fluorescent intensity. (C,E) Double immunostaining for anti-FITC (blue, C) or anti-PE (blue, D) and type IV collagen (brown) in F1 rat LNs 7 days after antigen-labeled parental T cell injection. Specific antibody-forming cells (AFCs, blue) against labeled antigen were detected polytopically in the medullary cord of F1 rat LNs 7 days after injection. C, cervical (upper panel) and mesenteric (lower panel) LNs; E, mediastinal LNs; MC, medullary cord; MS, medullary sinus. Scale bar = 100 μm (C,E) or 20 μm (C,E insets).
Figure 10
Figure 10
The proposed mechanism for the indirect pathway of allorecognition in the T cell areas of the spleen and LNs. Numbers in red (1, 2, 4, 6, 7, 9, 11, 12) are confirmed findings and those in blue (3, 5, 8, 10) are suggestions. 1. Migration of injected donor T cells to the T cell areas. Pertussis toxin (PTX) inhibits this process. 2. Clustering of donor T cells with recipient DCs. 3. Secretion of NK-recruiting chemokines by recipient DCs. 4. Recruitment of NK cells to the T cell areas. Anti-asialo GM1 antibody (Ab) inhibits this process. 5. Killing of donor T cells by NK cells. 6. Fragmentation of T cells in the T cell area. 7. Phagocytosis of donor T cell fragments by XCR1+ DCs, which was associated with upregulation of CD40 in these cells. 8. Transfer of captured antigenic information by XCR1+ DCs to resident XCR1 DCs in the T cell areas. 9. Cluster formation of both XCR1+CD103+ and XCR1CD103+ DCs in the T cell area. 10. Presentation of donor MHCI peptides to CD4+ T cells. 11. Proliferative response of CD4+ T cells in the cluster (24). 12. Antibody-forming cell response with production and secretion of donor-specific transfusion (DST) antibodies (24). Blue cells and green cells are donor and recipient cells, respectively. Red nuclei indicate proliferating cells. AFC, antibody-forming cell; Th, CD4+ T cell.

Similar articles

Cited by

References

    1. Siegrist CA. Vaccine immunology. In Vaccines. 5th ed. Plotkin SA, Orenstein RW, Offit PA, Edwards KM. editors. New York, NY: Saunders Elsevier; (2008). p. 17–36.
    1. Steinman RM, Banchereau J. Taking dendritic cells into medicine. Nature. (2007) 449:419–26. 10.1038/nature06175 - DOI - PubMed
    1. Kastenmuller W, Kastenmuller K, Kurts C, Seder RA. Dendritic cell-targeted vaccines–hope or hype? Nat Rev Immunol. (2014) 14:705–11. 10.1038/nri3727 - DOI - PubMed
    1. Davies JM, Lewis MP, Wimperis J, Rafi I, Ladhani S, Bolton-Maggs PH, et al. . Review of guidelines for the prevention and treatment of infection in patients with an absent or dysfunctional spleen: prepared on behalf of the British Committee for Standards in Haematology by a working party of the haemato-oncology task force. Br J Haematol. (2011) 155:308–17. 10.1111/j.1365-2141.2011.08843.x - DOI - PubMed
    1. Standring S. Gray's Anatomy, 39th ed. The Anatomical Basis of Clinical Practice. In: Blood, Lymphoid Tissues and Haemopoiesis. Churchill, MB: Livingstone; (2008). p. 75.

Publication types

MeSH terms