Comparative Study
. 2019 May 29:10:1200.
doi: 10.3389/fimmu.2019.01200. eCollection 2019.

Glucocorticoid Therapy of Multiple Sclerosis Patients Induces Anti-inflammatory Polarization and Increased Chemotaxis of Monocytes

Affiliations
Comparative Study

Glucocorticoid Therapy of Multiple Sclerosis Patients Induces Anti-inflammatory Polarization and Increased Chemotaxis of Monocytes

Henrike J Fischer et al. Front Immunol. .

Abstract

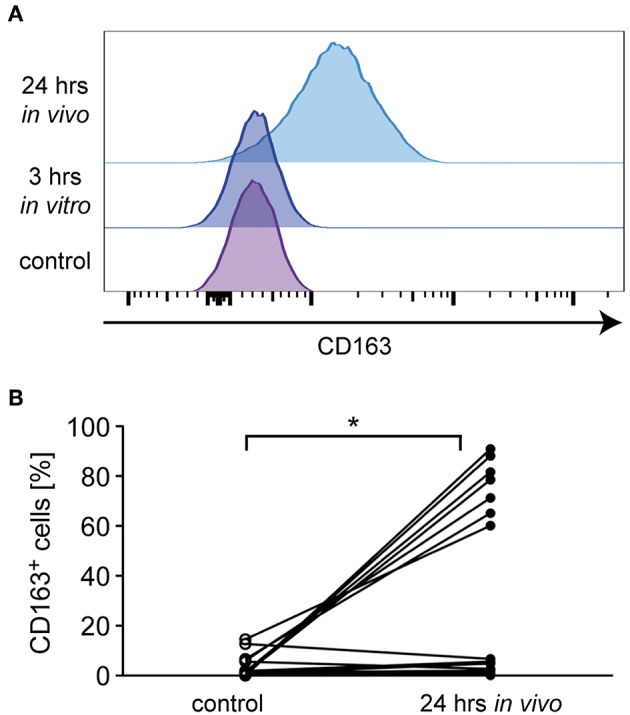
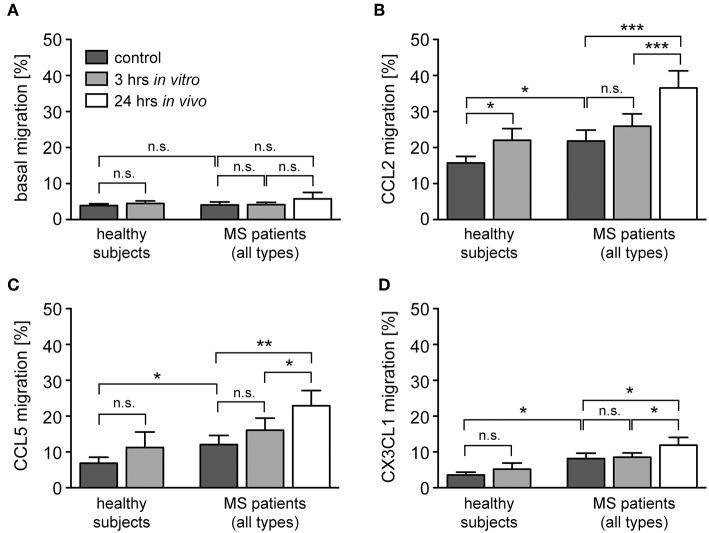
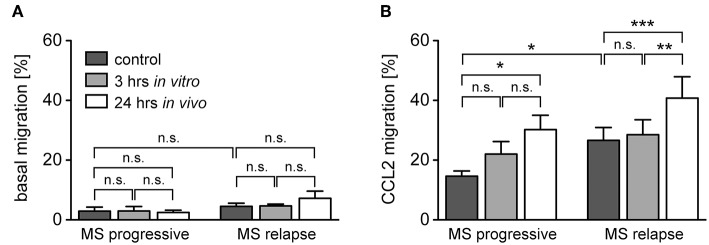
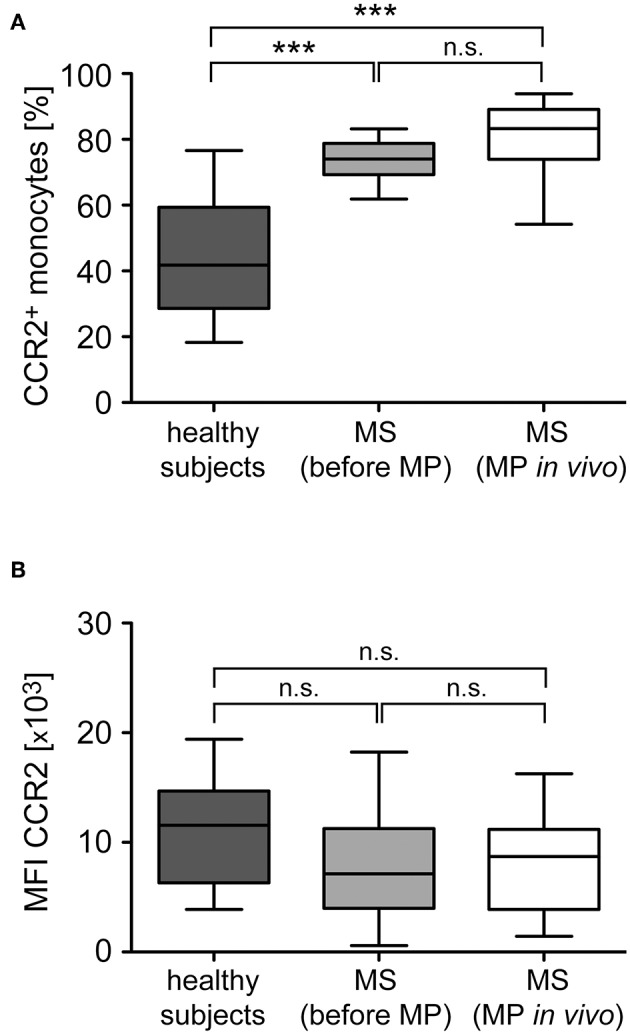
Multiple Sclerosis (MS) is an autoimmune disease of the central nervous system (CNS), characterized by the infiltration of mononuclear cells into the CNS and a subsequent inflammation of the brain. Monocytes are implicated in disease pathogenesis not only in their function as potential antigen-presenting cells involved in the local reactivation of encephalitogenic T cells but also by independent effector functions contributing to structural damage and disease progression. However, monocytes also have beneficial effects as they can exert anti-inflammatory activity and promote tissue repair. Glucocorticoids (GCs) are widely used to treat acute relapses in MS patients. They act on a variety of cell types but their exact mechanisms of action including their modulation of monocyte function are not fully understood. Here we investigated effects of the therapeutically relevant GC methylprednisolone (MP) on monocytes from healthy individuals and MS patients in vitro and in vivo. The monocyte composition in the blood was different in MS patients compared to healthy individuals, but it was only marginally affected by MP treatment. In contrast, application of MP caused a marked shift toward an anti-inflammatory monocyte phenotype in vitro and in vivo as revealed by an altered gene expression profile. Chemotaxis of monocytes toward CCL2, CCL5, and CX3CL1 was increased in MS patients compared to healthy individuals and further enhanced by MP pulse therapy. Both of these migration-promoting effects were more pronounced in MS patients with an acute relapse than in those with a progressive disease. Interestingly, the pro-migratory GC effect was independent of chemokine receptor levels as exemplified by results obtained for CCR2. Collectively, our findings suggest that GCs polarize monocytes toward an anti-inflammatory phenotype and enhance their migration into the inflamed CNS, endowing them with the capacity to suppress the pathogenic immune response.

Keywords: M2 polarization; chemokines; methylprednisolone therapy; monocytes; multiple sclerosis.


Figures

Figure 1
Figure 1
Representative FACS analysis illustrating the applied gating strategy. Monocytes were isolated from an MS patient and stained for CD14 and CD16 surface expression using fluorochrome-conjugated monoclonal antibodies. The left plot depicts the gating for living cells based on forward scatter (FSC) and side scatter (SSC). The right plot shows gating for classical CD14++CD16 monocytes, intermediate state CD14++CD16+ monocytes, and non-classical CD14+CD16++ monocytes. The borders of the gates and the percentages of cells therein are indicated in each plot.
Figure 2
Figure 2
Distribution of monocyte subsets in the peripheral blood of healthy subjects and MS patients with progressive disease or an acute relapse. Monocytes were isolated from the peripheral blood and the percentages of CD14++CD16 inflammatory monocytes (A), CD14++CD16+ intermediate state monocytes (B), and CD14+CD16++ non-classical monocytes (C) were determined by flow cytometry. MS patients were divided into two groups according to their disease activity (progressive, relapse). Data are presented as box-and-whiskers plots showing the minimum, maximum and median; n = 20 (healthy subjects), n = 8 (MS progressive), n = 12 (MS relapse). Statistical analysis was performed using a One-way ANOVA and Newman-Keuls Multiple Comparison test. Levels of significance: n.s. p ≥ 0.05; *p < 0.05; **p < 0.01; ***p < 0.001.
Figure 3
Figure 3
Impact of GC treatment on monocyte subset distribution in MS patients with progressive disease or an acute relapse. Monocytes were isolated from MS patients before MP pulse therapy and incubated for 3 h without (control) or with 10−6 M MP in vitro. A second blood sample was obtained from the same MS patients 24 h after MP pulse therapy in vivo. The percentages of CD14++CD16 inflammatory monocytes (A), CD14++CD16+ intermediate state monocytes (B), and CD14+CD16++ non-classical monocytes (C) were determined by flow cytometry. MS patients were divided into two groups according to their disease activity (progressive, relapse). Data are presented as the mean ± SEM; n = 8 (MS progressive), n = 12 (MS relapse). Statistical analysis was performed using a One-way ANOVA and Newman-Keuls Multiple Comparison test. Levels of significance: n.s. p ≥ 0.05; **p < 0.01 (control vs. 24 h); #p < 0.05 (3 vs. 24 h).
Figure 4
Figure 4
Modulation of the phenotype of monocytes from healthy subjects and MS patients by GCs. Monocytes were isolated from the peripheral blood and cultured without (control) or with 10−6 M MP for 3 h in vitro. A second blood sample was obtained from the same MS patients 24 h after MP pulse therapy in vivo. Thereafter, RNA was prepared and analyzed by quantitative RT-PCR for mRNA levels of NR3C1 (A), IL1B (B), CD163 (C), CD206 (D), IL10 (E), and ARG1 (F). Gene expression was evaluated using the ΔΔCt method and normalized to HPRT. Data are presented as the mean ± SEM; n = 6 (healthy individuals), n = 9 (MS patients). Statistical analysis was performed using a paired t-test (IL1B, CD206) or a Wilcox matched-pairs signed rank test (NR3C1, CD163, IL10, ARG1). Levels of significance: n.s. p ≥ 0.05; *p < 0.05; **p < 0.01.
Figure 5
Figure 5
Analysis of monocyte CD163 surface levels in MS patients. Monocytes were isolated from MS patients before MP pulse therapy and cultured without (control) or with 10−6 M MP for 3 h in vitro. A second blood sample was obtained from the same MS patients 24 h after MP pulse therapy in vivo. CD163 surface expression was analyzed by flow cytometry on all cells independently of the CD14/CD16 status. (A) Representative stacked histograms are depicted for an MS patient in which CD163 surface levels were upregulated after MP pulse therapy. (B) Percentages of CD163+ monocytes before (control) and 24 h after MP pulse therapy in vivo. The corresponding values for each patient are connected by a line. n = 15. Statistical analysis was performed using a Mann Whitney test. Levels of significance: *p < 0.05.
Figure 6
Figure 6
Monocyte migration along chemokine gradients in healthy subjects and MS patients under the influence of GCs. Monocytes were isolated from healthy subjects and MS patients before and after (24 h in vivo) MP pulse therapy. Cells were cultured in the absence (control) or presence of 10−6 M MP for 3 h in vitro and then transferred into the upper part of a Boyden chamber. Basal monocyte migration without a chemokine gradient (A) and migration toward a gradient of CCL2 (B), CCL5 (C), or CX3CL1 (D) into the lower part of the Boyden chamber were analyzed by flow cytometry and results are depicted as the percentage of transmigrated cells (mean ± SEM). n = 19/19/11/9 (healthy subjects), n = 13/15/12/17 (MS patients). For statistical analysis, untreated samples were compared to each other using a t-test, comparison of untreated vs. MP-treated samples from healthy subjects was performed using a paired t-test, and comparison of samples from MS patients to each other was performed using a One-way ANOVA and Newman-Keuls Multiple Comparison test. Levels of significance: n.s. p ≥ 0.05; *p < 0.05; **p < 0.01; ***p < 0.001.
Figure 7
Figure 7
Monocyte migration along a CCL2-gradient in MS patients with progressive disease or an acute relapse under the influence of GCs. The data are the same as in the experiment presented in Figure 4, but the MS patients are now divided into two groups according to their disease activity. Basal monocyte migration without a chemokine gradient (A) and migration toward a gradient of CCL2 (B) into the lower part of the Boyden chamber were analyzed by flow cytometry and are depicted as the percentage of transmigrated cells (mean ± SEM); n = 4/6 (progressive), n = 9/9 (relapse). For statistical analysis, untreated samples were compared using a t-test and comparison of samples from MS patients to each other was performed using a One-way ANOVA and Newman-Keuls Multiple Comparison test. Levels of significance: n.s. p ≥ 0.05; *p < 0.05; **p < 0.01; ***p < 0.001.
Figure 8
Figure 8
Analysis of CCR2 surface expression levels in monocytes from healthy subjects and MS patients before and after GC treatment in vivo. Monocytes were isolated from healthy subjects as well as MS patients before and 24 h after MP pulse therapy in vivo. CCR2 surface expression was analyzed by flow cytometry and subsequently the percentage of CCR2+ monocytes (A) and the surface level of CCR2 based on the mean fluorescence intensity (MFI) were determined (B). Data are presented as box-and-whiskers plots showing the minimum, maximum and median; n = 13/22/17. Statistical analysis was performed using a One-way ANOVA and Newman-Keuls Multiple Comparison test. Levels of significance: n.s. p ≥ 0.05; ***p < 0.001.

References

    1. Sospedra M, Martin R. Immunology of multiple sclerosis. Semin Neurol. (2016) 36:115–27. 10.1055/s-0036-1579739 - DOI - PubMed
    1. Milligan NM, Newcombe R, Compston DAS. A double-blind controlled trial of high-dose methylprednisolone in patients with multiple-sclerosis.1. Clinical effects. J Neurol Neurosurg Psychiatry. (1987) 50:511–6. 10.1136/jnnp.50.5.511 - DOI - PMC - PubMed
    1. Buttgereit F, Straub RH, Wehling M, Burmester GR. Glucocorticoids in the treatment of rheumatic diseases - an update on the mechanisms of action. Arthritis Rheum. (2004) 50:3408–17. 10.1002/art.20583 - DOI - PubMed
    1. Zen M, Canova M, Campana C, Bettio S, Nalotto L, Rampudda M, et al. . The kaleidoscope of glucorticoid effects on immune system. Autoimmun Rev. (2011) 10:305–10. 10.1016/j.autrev.2010.11.009 - DOI - PubMed
    1. Franco LM, Gadkari M, Howe KN, Sun J, Kardava L, Kumar P, et al. . Immune regulation by glucocorticoids can be linked to cell type-dependent transcriptional responses. J Exp Med. (2019) 216:384–406. 10.1084/jem.20180595 - DOI - PMC - PubMed

Publication types

MeSH terms