

Whole Genome Linkage Disequilibrium and Effective Population Size in a Coho Salmon (Oncorhynchus kisutch) Breeding Population Using a High-Density SNP Array
- PMID: 31191613
- PMCID: PMC6539196
- DOI: 10.3389/fgene.2019.00498
Whole Genome Linkage Disequilibrium and Effective Population Size in a Coho Salmon (Oncorhynchus kisutch) Breeding Population Using a High-Density SNP Array
Abstract
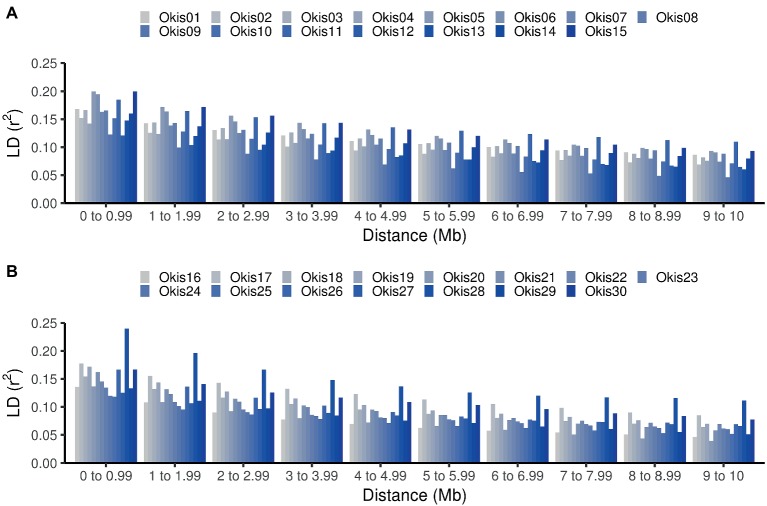
The estimation of linkage disequilibrium between molecular markers within a population is critical when establishing the minimum number of markers required for association studies, genomic selection, and inferring historical events influencing different populations. This work aimed to evaluate the extent and decay of linkage disequilibrium in a coho salmon breeding population using a high-density SNP array. Linkage disequilibrium was estimated between a total of 93,502 SNPs found in 64 individuals (33 dams and 31 sires) from the breeding population. The markers encompass all 30 coho salmon chromosomes and comprise 1,684.62 Mb of the genome. The average density of markers per chromosome ranged from 48.31 to 66 per 1 Mb. The minor allele frequency averaged 0.26 (with a range from 0.22 to 0.27). The overall average linkage disequilibrium among SNPs pairs measured as r 2 was 0.10. The Average r 2 value decreased with increasing physical distance, with values ranging from 0.21 to 0.07 at a distance lower than 1 kb and up to 10 Mb, respectively. An r 2 threshold of 0.2 was reached at distance of approximately 40 Kb. Chromosomes Okis05, Okis15 and Okis28 showed high levels of linkage disequilibrium (>0.20 at distances lower than 1 Mb). Average r 2 values were lower than 0.15 for all chromosomes at distances greater than 4 Mb. An effective population size of 43 was estimated for the population 10 generations ago, and 325, for 139 generations ago. Based on the effective number of chromosome segments, we suggest that at least 74,000 SNPs would be necessary for an association mapping study and genomic predictions. Therefore, the SNP panel used allowed us to capture high-resolution information in the farmed coho salmon population. Furthermore, based on the contemporary N e, a new mate allocation strategy is suggested to increase the effective population size.
Keywords: GWAS; Oncorhynchus kisutch; effective population size; linkage disequilibrium; selective breeding.
Figures


Similar articles
-
Population Genomic Structure and Genome-Wide Linkage Disequilibrium in Farmed Atlantic Salmon (Salmo salar L.) Using Dense SNP Genotypes.Front Genet. 2018 Dec 14;9:649. doi: 10.3389/fgene.2018.00649. eCollection 2018. Front Genet. 2018. PMID: 30619473 Free PMC article.
-
Extent of linkage disequilibrium and effective population size in Finnish Landrace and Finnish Yorkshire pig breeds.J Anim Sci. 2011 Mar;89(3):609-14. doi: 10.2527/jas.2010-3249. Epub 2010 Oct 29. J Anim Sci. 2011. PMID: 21036932
-
Linkage disequilibrium and haplotype block patterns in popcorn populations.PLoS One. 2019 Sep 25;14(9):e0219417. doi: 10.1371/journal.pone.0219417. eCollection 2019. PLoS One. 2019. PMID: 31553737 Free PMC article.
-
Linkage disequilibrium, persistence of phase, and effective population size in Spanish local beef cattle breeds assessed through a high-density single nucleotide polymorphism chip.J Anim Sci. 2016 Jul;94(7):2779-88. doi: 10.2527/jas.2016-0425. J Anim Sci. 2016. PMID: 27482665
-
Linkage Disequilibrium Estimation of Chinese Beef Simmental Cattle Using High-density SNP Panels.Asian-Australas J Anim Sci. 2013 Jun;26(6):772-9. doi: 10.5713/ajas.2012.12721. Asian-Australas J Anim Sci. 2013. PMID: 25049849 Free PMC article.
Cited by
-
Estimates of Autozygosity Through Runs of Homozygosity in Farmed Coho Salmon.Genes (Basel). 2020 Apr 30;11(5):490. doi: 10.3390/genes11050490. Genes (Basel). 2020. PMID: 32365758 Free PMC article.
-
Population Genomic Structure and Genome-Wide Linkage Disequilibrium in Farmed Atlantic Salmon (Salmo salar L.) Using Dense SNP Genotypes.Front Genet. 2018 Dec 14;9:649. doi: 10.3389/fgene.2018.00649. eCollection 2018. Front Genet. 2018. PMID: 30619473 Free PMC article.
-
Application of Low Coverage Genotyping by Sequencing in Selectively Bred Arctic Charr (Salvelinus alpinus).G3 (Bethesda). 2020 Jun 1;10(6):2069-2078. doi: 10.1534/g3.120.401295. G3 (Bethesda). 2020. PMID: 32312839 Free PMC article.
-
Detection of selection signatures in farmed coho salmon (Oncorhynchus kisutch) using dense genome-wide information.Sci Rep. 2021 May 6;11(1):9685. doi: 10.1038/s41598-021-86154-w. Sci Rep. 2021. PMID: 33958603 Free PMC article.
-
Marker genotyping error effects on genomic predictions under different genetic architectures.Mol Genet Genomics. 2021 Jan;296(1):79-89. doi: 10.1007/s00438-020-01728-z. Epub 2020 Sep 29. Mol Genet Genomics. 2021. PMID: 32995954
References
-
- Barría A., Christensen K. A., Yoshida G. M., Correa K., Jedlicki A., Lhorente J. P., et al. (2018a). Genomic predictions and genome-wide association study of resistance against Piscirickettsia salmonis in coho salmon (Oncorhynchus kisutch) using ddRAD sequencing. G3 Genes Genomes Genet. 8, 1183–1194. 10.1534/g3.118.200053 - DOI - PMC - PubMed
LinkOut - more resources
Full Text Sources
Miscellaneous