. 2019 May 29:10:508.
doi: 10.3389/fgene.2019.00508. eCollection 2019.

F8 Inversions at Xq28 Causing Hemophilia A Are Associated With Specific Methylation Changes: Implication for Molecular Epigenetic Diagnosis

Affiliations

F8 Inversions at Xq28 Causing Hemophilia A Are Associated With Specific Methylation Changes: Implication for Molecular Epigenetic Diagnosis

Muhammad Ahmer Jamil et al. Front Genet. .

Abstract

Diverse DNA structural variations (SVs) in human cancers and several other diseases are well documented. For genomic inversions in particular, the disease causing mechanism may not be clear, especially if the inversion border does not cross a coding sequence. Understanding about the molecular processes of these inverted genomic sequences, in a mainly epigenetic context, may provide additional information regarding sequence-specific regulation of gene expression in human diseases. Herein, we study one such inversion hotspot at Xq28, which leads to the disruption of F8 gene and results in hemophilia A phenotype. To determine the epigenetic consequence of this rearrangement, we evaluated DNA methylation levels of 12 CpG rich regions with the coverage of 550 kb by using bisulfite-pyrosequencing and next-generation sequencing (NGS)-based bisulfite re-sequencing enrichment assay. Our results show that this inversion prone area harbors widespread methylation changes at the studied regions. However, only 5/12 regions showed significant methylation changes, specifically in case of intron 1 inversion (two regions), intron 22 inversion (two regions) and one common region in both inversions. Interestingly, these aberrant methylated regions were found to be overlapping with the inversion proximities. In addition, two CpG sites reached 100% sensitivity and specificity to discriminate wild type from intron 22 and intron 1 inversion samples. While we found age to be an influencing factor on methylation levels at some regions, covariate analysis still confirms the differential methylation induced by inversion, regardless of age. The hemophilia A methylation inversion "HAMI" assay provides an advantage over conventional PCR-based methods, which may not detect novel rare genomic rearrangements. Taken together, we showed that genomic inversions in the F8 (Xq28) region are associated with detectable changes in methylation levels and can be used as an epigenetic diagnostic marker.

Keywords: DNA methylation; epigenetic; hemophilia; inversion; molecular diagnosis; structural rearrangement.


Figures
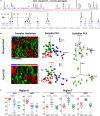
FIGURE 1
FIGURE 1
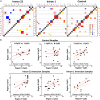
Pyrosequencing methylation data on 12 selected regions from intron 22 and intron 1-inversion samples as well as healthy male controls. (A) Detailed map on X chromosome (Chr X: 154,027,275-154,751,861:hg19) showing F8, the three Int22h and the two Int1h repeats involved in the inversion mutations. The positions of the studied regions are indicated in the middle region by capital letters. The inversion prone regions are labeled with red and blue horizontal lines for intron-22 and intron-1 inversions, respectively. (B) Methylation data represented by heatmaps, sample PCA and variable PCA plots. (C) Detailed data of the methylation values for individual samples at the two best regions (H and F) that clearly distinguish between inverted and non-inverted control samples.
FIGURE 2
FIGURE 2
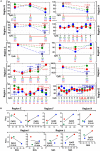
Correlation analysis between the studied CpG sites. (A) Heatmaps representing Pearson correlation (left upper triangle) and p-values (right lower triangle). The CpG rich region names are labeled with capital letters, while the individual CpGs are labeled with numbers, whereby red ones represent statistically significant ones. When two significant CpGs from two regions are correlated they are highlighted with a blue circle. (B) Correlation graphs of the circled ones of part A. The best fit linear curves as well as the 95% confidence intervals are shown in red.
FIGURE 3
FIGURE 3
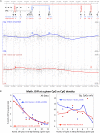
NGS results of the studied regions shown in Figure 1A. (A) Each graph represents one region; regions A and N have no enough coverage and are absent. The number of reads for each CpG is shown below the corresponding CpG, the p-value of Fisher’s exact test is shown when significant (marked by X) between healthy samples (green) and intron 1-inversion samples (blue) or intron 22-inversion samples (red). The corresponding pyrosequencing CpGs are in red and underlined. (B) Correlation graphs between the pyrosequencing and the NGS methylation levels results.
FIGURE 4
FIGURE 4
Global visualization of NGS data in the F8 region (hg19: Chr X 154,027,275–154,751,861). (A) Upper panel shows the relative positions of the studied pyrosequencing regions, the middle panel shows the NGS data for intron 1 inversion samples and the lower panel the intron 22 inversion samples. The covered individual CpG methylation data are represented by a gray dot, while additionally, the data is represented by a smooth curve representing the trend of changes between the inverted and the control samples. CpG sites with less than 30 coverage or overlapping with known SNPs or repeats were excluded. Red and blue stars indicate the DNA inversion junctions. (B) Correlation between the methylation differences at a given CpG and the density of CpG within 50 bp flanking region. Left and right side include all CpG data and only significant data (Fisher’s exact test), respectively.

Similar articles

Cited by

References

    1. Akalin A., Kormaksson M., Li S., Garrett-Bakelman F. E., Figueroa M. E., Melnick A., et al. (2012). methylKit: a comprehensive R package for the analysis of genome-wide DNA methylation profiles. Genome Biol. 13:R87. 10.1186/gb-2012-13-10-r87 - DOI - PMC - PubMed
    1. Andrikovics H., Klein I., Bors A., Nemes L., Marosi A., Varadi A., et al. (2003). Analysis of large structural changes of the factor VIII gene, involving intron 1 and 22, in severe hemophilia A. Haematologica 88 778–784. - PubMed
    1. Auton A., Brooks L. D., Durbin R. M., Garrison E. P., Kang H. M., Korbel J. O., et al. (2015). A global reference for human genetic variation. Nature 526 68–74. 10.1038/nature15393 - DOI - PMC - PubMed
    1. Bagnall R. D., Giannelli F., Green P. M. (2006). Int22h-related inversions causing hemophilia A: a novel insight into their origin and a new more discriminant PCR test for their detection. J. Thromb. Haemost. 4 591–598. 10.1111/j.1538-7836.2006.01840.x - DOI - PubMed
    1. Bagnall R. D., Waseem N., Green P. M., Giannelli F. (2002). Recurrent inversion breaking intron 1 of the factor VIII gene is a frequent cause of severe hemophilia A. Blood 99 168–174. 10.1182/blood.v99.1.168 - DOI - PubMed