

Directional Topography Influences Adipose Mesenchymal Stromal Cell Plasticity: Prospects for Tissue Engineering and Fibrosis
- PMID: 31191675
- PMCID: PMC6525798
- DOI: 10.1155/2019/5387850
Directional Topography Influences Adipose Mesenchymal Stromal Cell Plasticity: Prospects for Tissue Engineering and Fibrosis
Abstract
Introduction: Progenitor cells cultured on biomaterials with optimal physical-topographical properties respond with alignment and differentiation. Stromal cells from connective tissue can adversely differentiate to profibrotic myofibroblasts or favorably to smooth muscle cells (SMC). We hypothesized that myogenic differentiation of adipose tissue-derived stromal cells (ASC) depends on gradient directional topographic features.
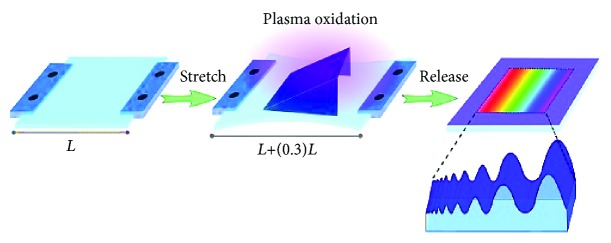
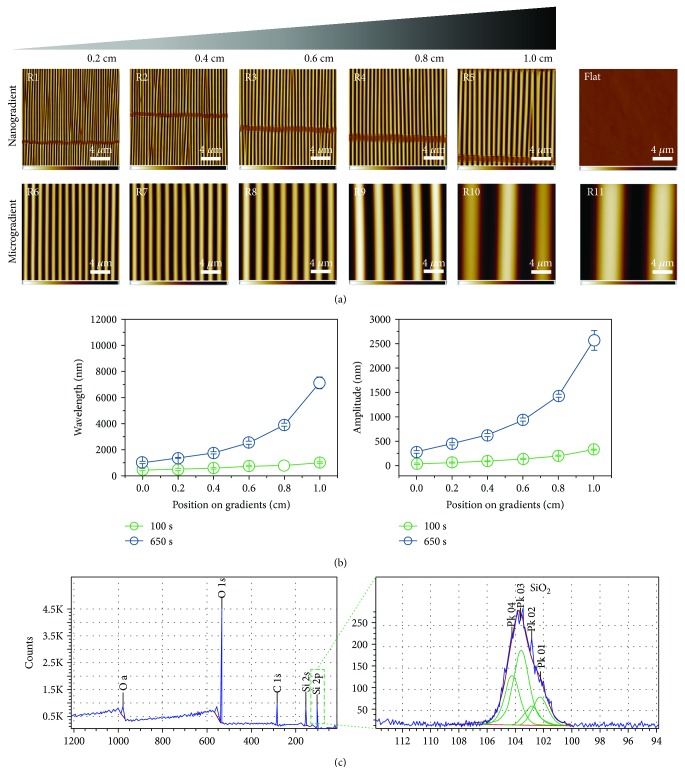
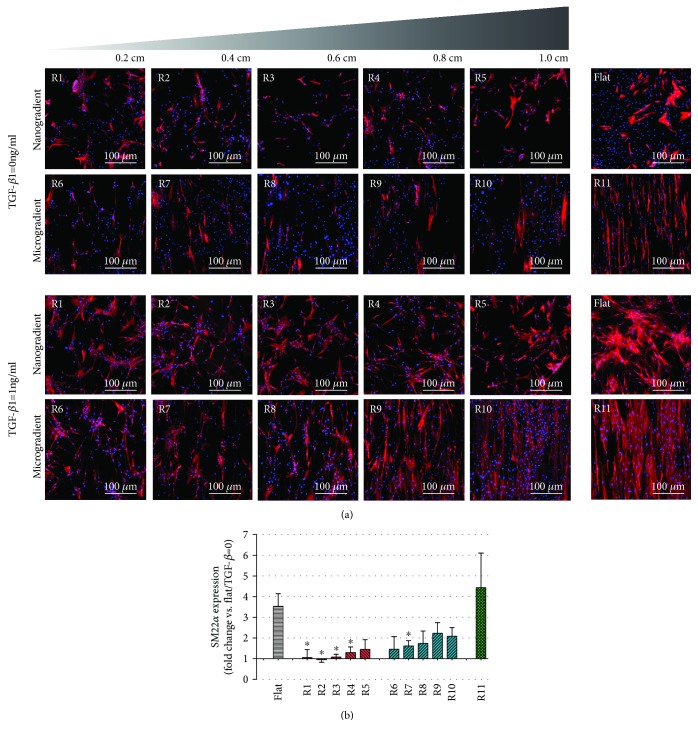
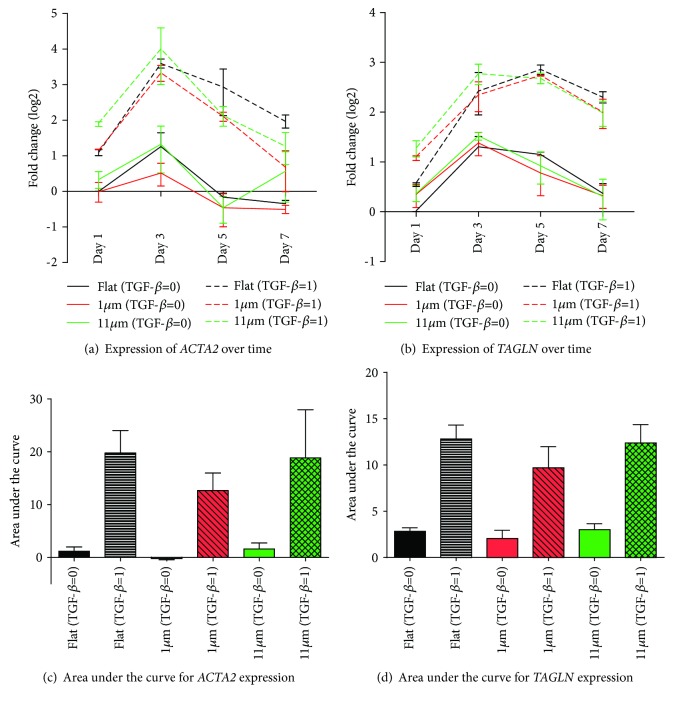
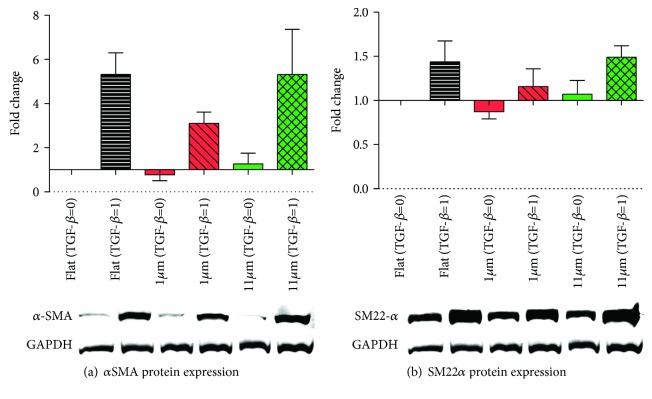
Methods: Polydimethylsiloxane (PDMS) samples with nanometer and micrometer directional topography gradients (wavelength (w) = 464-10, 990 nm; amplitude (a) = 49-3, 425 nm) were fabricated. ASC were cultured on patterned PDMS and stimulated with TGF-β1 to induce myogenic differentiation. Cellular alignment and adhesion were assessed by immunofluorescence microscopy after 24 h. After seven days, myogenic differentiation was examined by immunofluorescence microscopy, gene expression, and immunoblotting.
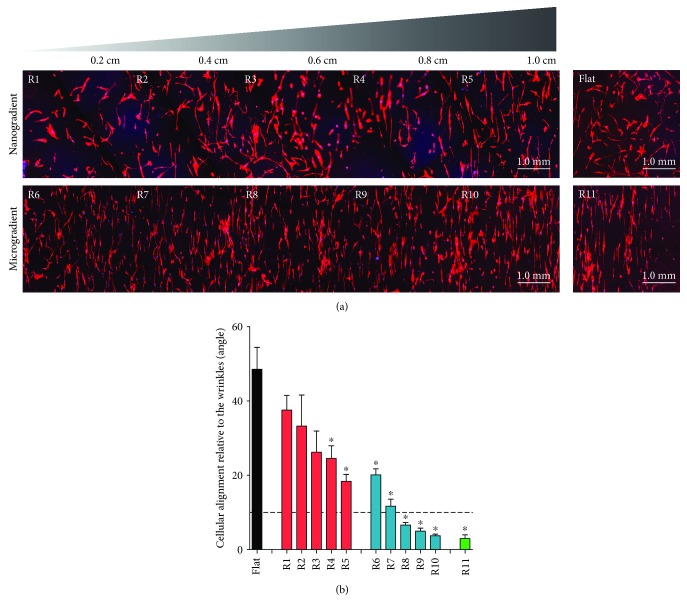
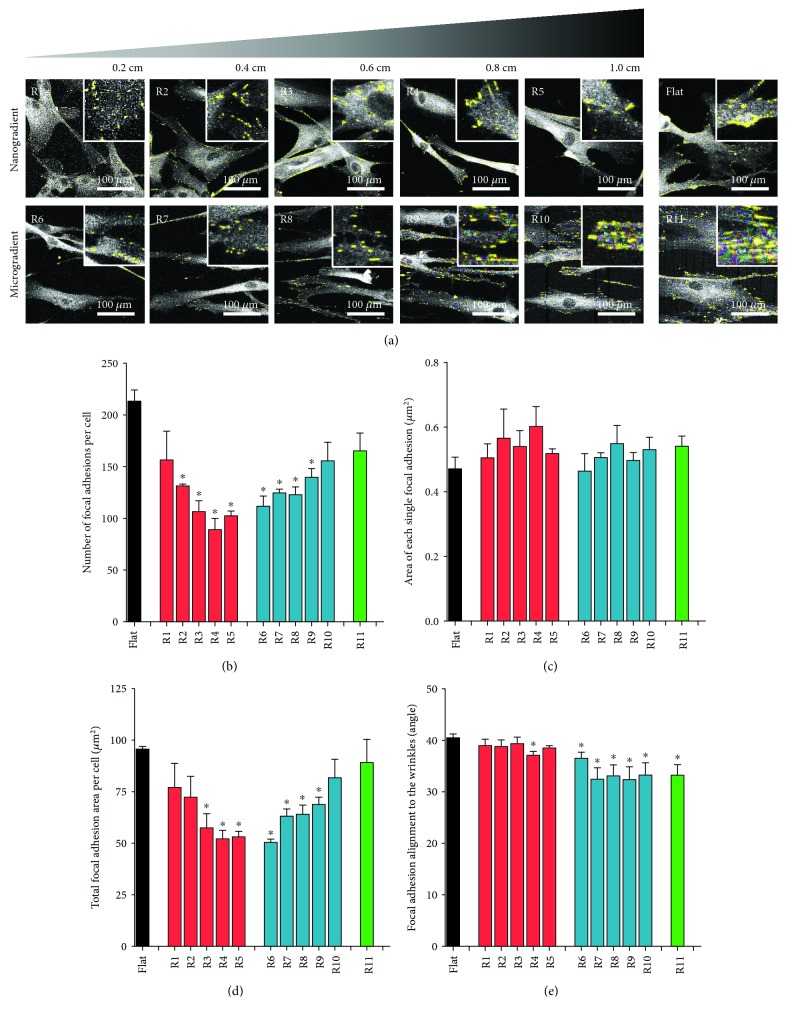
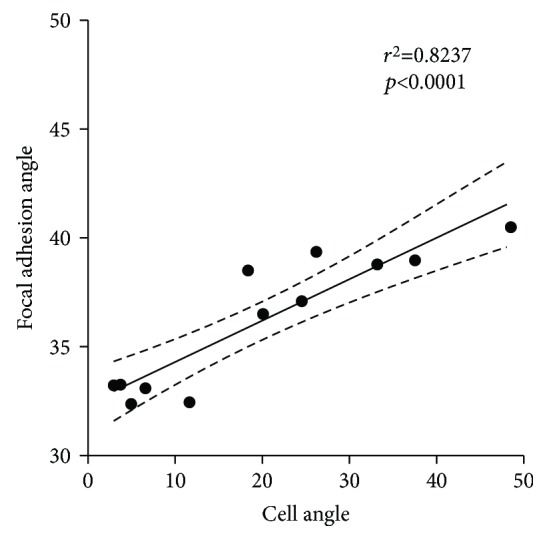
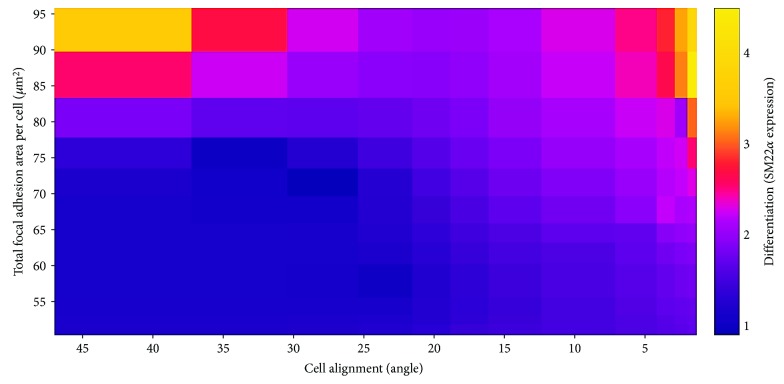
Results: Cell alignment occurred on topographies larger than w = 1758 nm/a = 630 nm. The number and total area of focal adhesions per cell were reduced on topographies from w = 562 nm/a = 96 nm to w = 3919 nm/a = 1430 nm. Focal adhesion alignment was increased on topographies larger than w = 731 nm/a = 146 nm. Less myogenic differentiation of ASC occurred on topographies smaller than w = 784 nm/a = 209 nm.
Conclusion: ASC adherence, alignment, and differentiation are directed by topographical cues. Our evidence highlights a minimal topographic environment required to facilitate the development of aligned and differentiated cell layers from ASC. These data suggest that nanotopography may be a novel tool for inhibiting fibrosis.
Figures
Similar articles
-
Efficient generation of smooth muscle cells from adipose-derived stromal cells by 3D mechanical stimulation can substitute the use of growth factors in vascular tissue engineering.Biotechnol J. 2016 Jul;11(7):932-44. doi: 10.1002/biot.201500519. Epub 2016 May 6. Biotechnol J. 2016. PMID: 26989865
-
Directional topography gradients drive optimum alignment and differentiation of human myoblasts.J Tissue Eng Regen Med. 2019 Dec;13(12):2234-2245. doi: 10.1002/term.2976. Epub 2019 Nov 10. J Tissue Eng Regen Med. 2019. PMID: 31677226 Free PMC article.
-
The synergistic effect of surface topography and sustained release of TGF-β1 on myogenic differentiation of human mesenchymal stem cells.J Biomed Mater Res A. 2016 Jul;104(7):1610-21. doi: 10.1002/jbm.a.35686. Epub 2016 Mar 11. J Biomed Mater Res A. 2016. PMID: 26879731
-
Topography-driven alterations in endothelial cell phenotype and contact guidance.Heliyon. 2020 Jun 29;6(6):e04329. doi: 10.1016/j.heliyon.2020.e04329. eCollection 2020 Jun. Heliyon. 2020. PMID: 32637708 Free PMC article.
-
Matrix Topographical Cue-Mediated Myogenic Differentiation of Human Embryonic Stem Cell Derivatives.Polymers (Basel). 2017 Nov 5;9(11):580. doi: 10.3390/polym9110580. Polymers (Basel). 2017. PMID: 30965882 Free PMC article.
Cited by
-
Inferior collicular cells that project to the auditory thalamus are increasingly surrounded by perineuronal nets with age.Neurobiol Aging. 2021 Sep;105:1-15. doi: 10.1016/j.neurobiolaging.2021.04.001. Epub 2021 Apr 21. Neurobiol Aging. 2021. PMID: 34004491 Free PMC article.
-
Anisometric Microstructures to Determine Minimal Critical Physical Cues Required for Neurite Alignment.Adv Healthc Mater. 2021 Oct;10(20):e2100874. doi: 10.1002/adhm.202100874. Epub 2021 Jul 1. Adv Healthc Mater. 2021. PMID: 34197054 Free PMC article.
-
Intrapericardial injection of hydrogels with ASC and their secretome to treat dilated cardiomyopathies.Sci Rep. 2025 Jan 28;15(1):3529. doi: 10.1038/s41598-025-87939-z. Sci Rep. 2025. PMID: 39875493 Free PMC article.
-
The Density of Perineuronal Nets Increases With Age in the Inferior Colliculus in the Fischer Brown Norway Rat.Front Aging Neurosci. 2020 Feb 11;12:27. doi: 10.3389/fnagi.2020.00027. eCollection 2020. Front Aging Neurosci. 2020. PMID: 32116654 Free PMC article.
-
Synergistic Effect of Cell-Derived Extracellular Matrices and Topography on Osteogenesis of Mesenchymal Stem Cells.ACS Appl Mater Interfaces. 2020 Jun 10;12(23):25591-25603. doi: 10.1021/acsami.0c05012. Epub 2020 May 27. ACS Appl Mater Interfaces. 2020. PMID: 32423202 Free PMC article.
References
LinkOut - more resources
Full Text Sources
Miscellaneous
