. 2019 May 2:2019:8710180.
doi: 10.1155/2019/8710180. eCollection 2019.

Downregulation of an Evolutionary Young miR-1290 in an iPSC-Derived Neural Stem Cell Model of Autism Spectrum Disorder

Affiliations

Downregulation of an Evolutionary Young miR-1290 in an iPSC-Derived Neural Stem Cell Model of Autism Spectrum Disorder

Dalia Moore et al. Stem Cells Int. .

Abstract

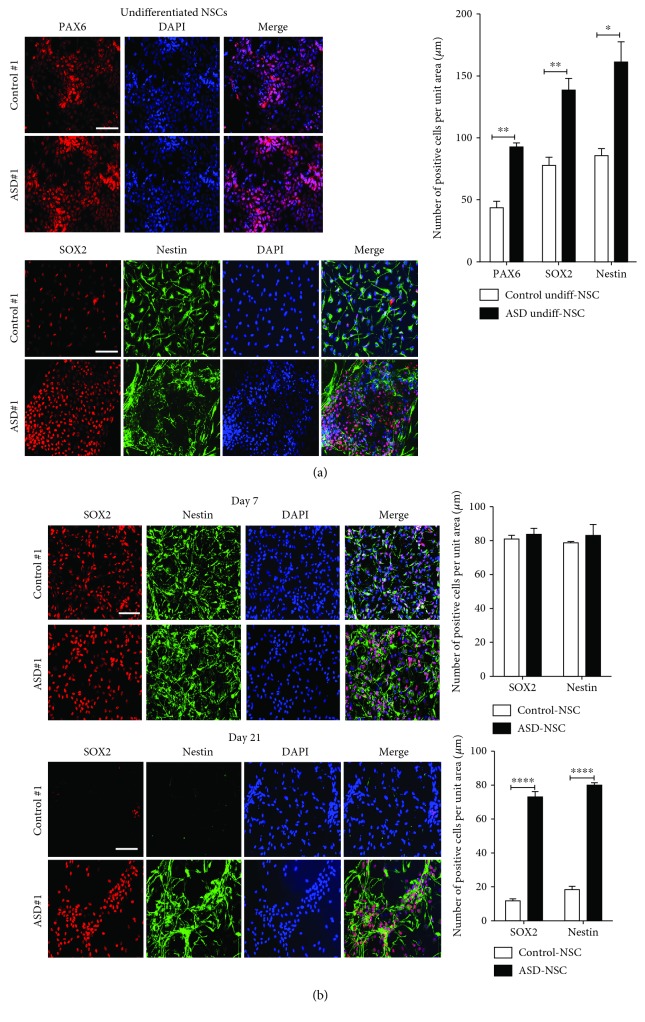
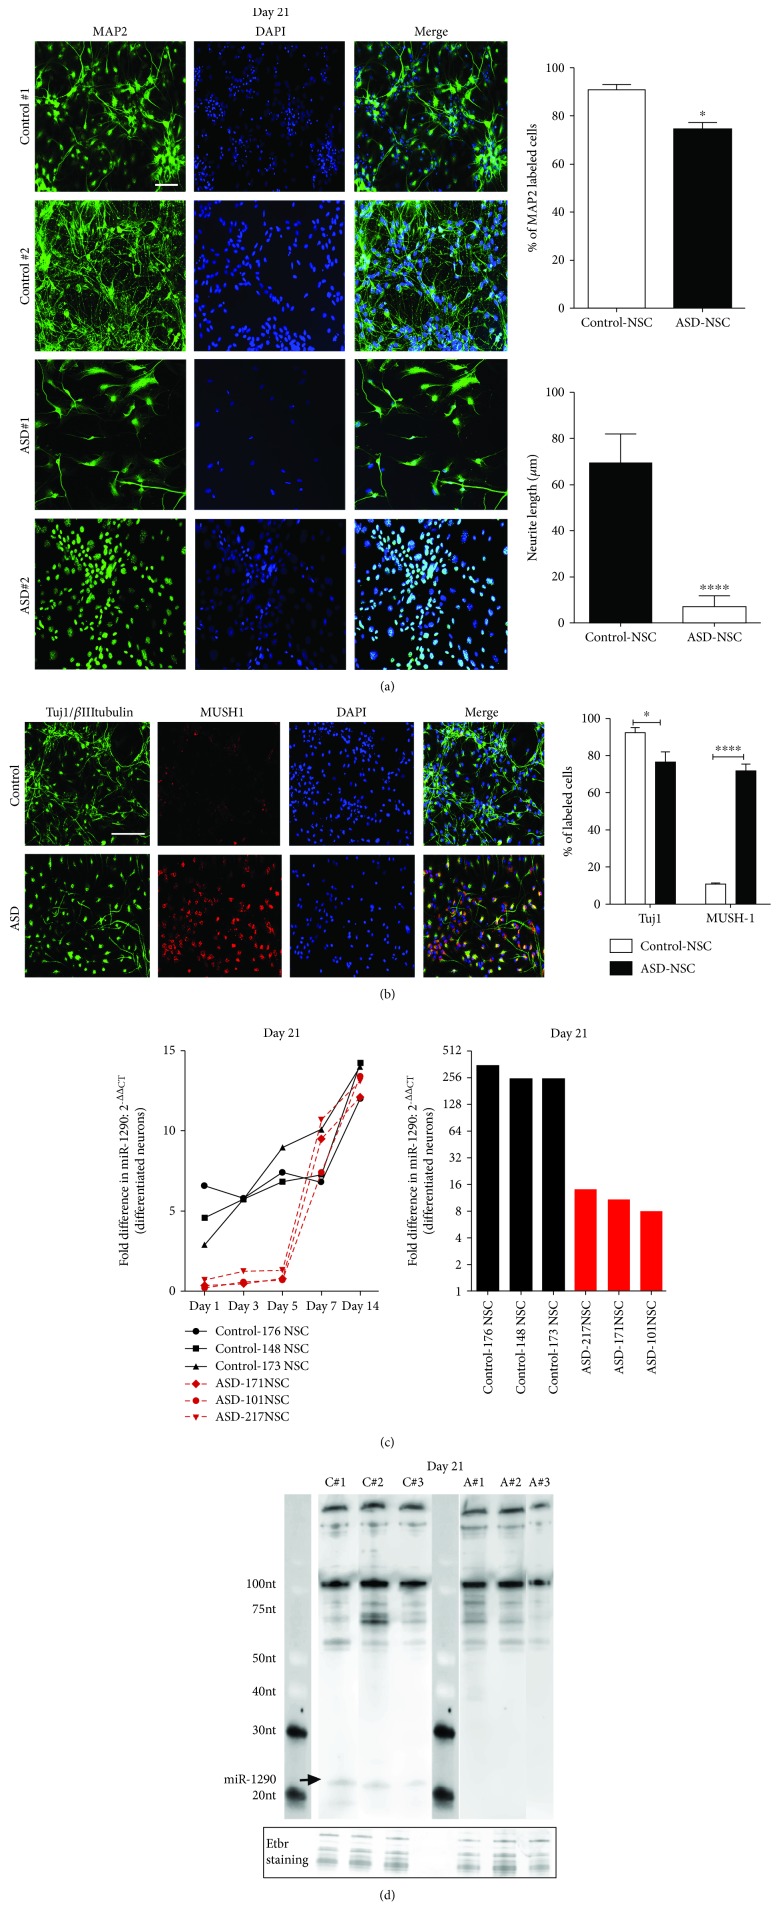
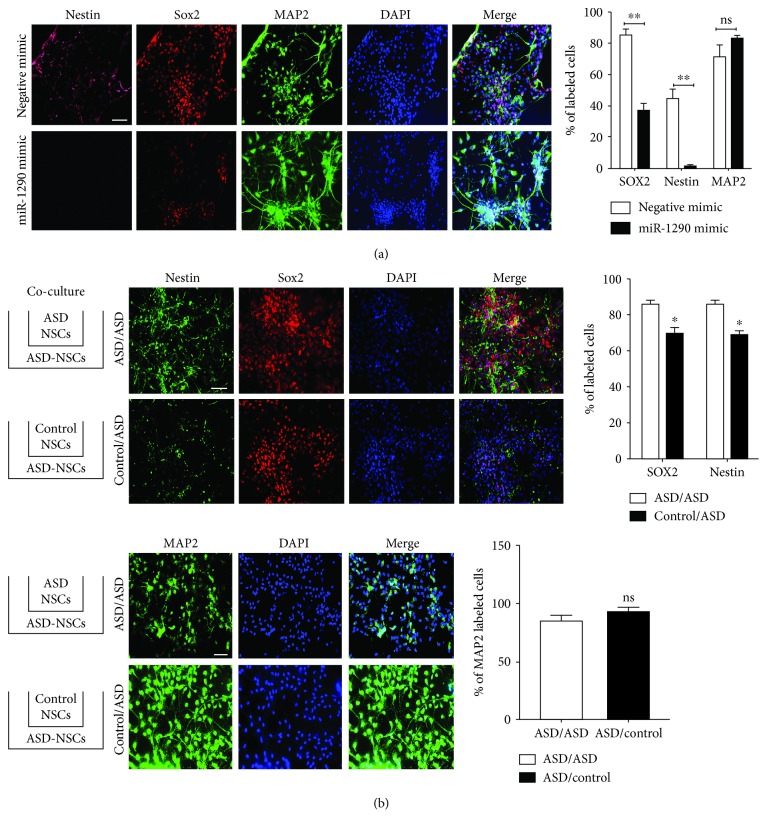
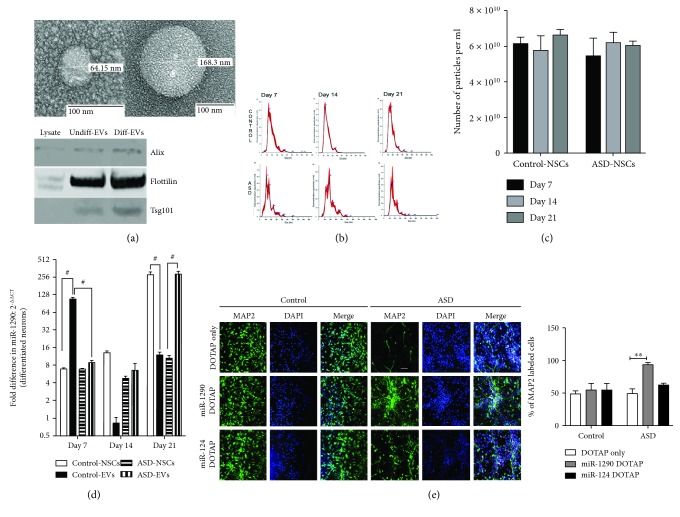
The identification of several evolutionary young miRNAs, which arose in primates, raised several possibilities for the role of such miRNAs in human-specific disease processes. We previously have identified an evolutionary young miRNA, miR-1290, to be essential in neural stem cell proliferation and neuronal differentiation. Here, we show that miR-1290 is significantly downregulated during neuronal differentiation in reprogrammed induced pluripotent stem cell- (iPSC-) derived neurons obtained from idiopathic autism spectrum disorder (ASD) patients. Further, we identified that miR-1290 is actively released into extracellular vesicles. Supplementing ASD patient-derived neural stem cells (NSCs) with conditioned media from differentiated control-NSCs spiked with "artificial EVs" containing synthetic miR-1290 oligonucleotides significantly rescued differentiation deficits in ASD cell lines. Based on our earlier published study and the observations from the data presented here, we conclude that miR-1290 regulation could play a critical role during neuronal differentiation in early brain development.


Figures

Figure 1
Figure 1
Neural progenitor markers are significantly enhanced in ASD-NSCs. (a) Immunostaining and statistical analysis indicate significantly more progenitor cells (Pax6+, Nestin+, and Sox2+) in ASD-NSCs than in control-NSCs. Bar = 20 μm. N = 3, P < 0.01, and ∗∗∗ P < 0.001 (n = 3), determined by an unpaired t-test and corrected by the Holm-Sidak multiple correction post hoc test. (b) No differences in Nestin+ or Sox2+ NSCs were observed in day 7-differentiated control and ASD-NSCs; however, significantly more progenitor cells were observed in day 21-differentiated ASD-NSCs. ∗∗∗∗ P < 0.0001 (n = 3), determined by an unpaired t-test and corrected by the Holm-Sidak multiple correction post hoc test. Bar = 20 μm. Data are represented as the mean ± SEM.
Figure 2
Figure 2
ASD-NSCs display perturbations in neuronal phenotype during early days of differentiation. (a) Differentiated neurons from ASD-NSCs display shorter neurites when compared to neurons differentiated from control-NSCs. A strong staining of the cell body is seen in neurons derived from ASD-NSCs. Bar = 20 μm. P < 0.05 and ∗∗∗∗ P < 0.0001, n = 3, determined by an unpaired t-test. (b) Immunostaining for other differentiation markers such as tuj1 or βIIItubulin and stem cell marker Mushashi1 (Mush1) also shows differential staining in neurons derived from ASD-NSCs than control-NSCs. Bar = 20 μm. P < 0.01 and ∗∗∗∗ P < 0.0001, n = 3, determined by an unpaired t-test. (c) RNA was extracted from days 1, 3, 5, 7, 14, and 21, and qRT-PCR was conducted for miR-1290. A stable increase in expression was seen in control-NSCs during days of differentiation from day 1 to day 14 whereas at day 21 a significant downregulation in miR-1290 expression was observed in ASD-NSCs. An unpaired t-test followed by the Holm-Sidak multiple correction post hoc test revealed significant differences in days 1 ( P < 0.01), 3 (∗∗∗∗ P < 0.0001), and 5 (∗∗∗ P = 0.0005). Analysis on day 21 expression revealed a significance of ∗∗ P < 0.01 (n = 3), determined by an unpaired t-test. Data are represented as the mean ± SEM. (d) Representative northern blot of RNA derived from day 21 differentiated from three individual donors from control- and ASD-NSCs; note that the anti-DIG signals for the mature form (∼21 nt) were only seen in the control cases. A prestained small molecular weight miRNA marker was used to monitor RNA size.
Figure 3
Figure 3
Overexpression of coculture rescued the phenotype (a) Undifferentiated ASD-NSCs were plated and differentiated for 21 days in the presence of miR-1290 and negative mimics followed by immunostaining. Results indicate a significant decrease in progenitor cells but no difference in MAP2-expressing cells was seen. Bar = 20 μm. ∗∗ P < 0.001 (n = 3 donors), determined by an unpaired t-test and corrected by the Holm-Sidak multiple correction post hoc test. (b) Coculture with control-NSCs decreased significantly the progenitor cells (Nestin, Sox2) whereas no effect was seen on neuronal MAP2 cells. P < 0.01 (n = 3 donors), determined by an unpaired t-test and corrected by the Holm-Sidak multiple correction post hoc test. Data are represented as the mean ± SEM.
Figure 4
Figure 4
mir-1290 is secreted in extracellular vesicles (EVs). (a) Top: transmission electron microscopy (TEM) of EVs isolated from NSCs shows the presence of different sizes of EVs isolated from control-NSC culture media. Bottom: western blot of EVs from NSC whole cell lysate (lysate) and undifferentiated (undiff) and differentiated (diff) EVs shows the presence of EV markers Alix, Flotillin, and Tsg101 enriched in the EV fraction. (b, c) Nanoparticle tracking analysis (NTA, nanosight) revealed no significant differences in the concentration of the particles between control- and ASD-NSC-derived EVs (n = 3 donors). (d) RT-PCR data indicates that miR-1290 levels are significantly upregulated in EVs isolated from day 21-differentiated ASD-NSC when compared to the EVs isolated from control-NSCs. # represents significance. ∗∗∗∗ P < 0.0001 (days 7 and 14) and ∗∗ P < 0.001 (day 21) (n = 3 donors), determined by an unpaired t-test and corrected by the Holm-Sidak multiple correction post hoc test. (e) Undifferentiated ASD-NSCs were plated and differentiated for 21 days in the presence of miR-1290, miR-124, and negative mimics complexed with DOTAP followed by immunostaining with neuronal marker MAP2. Results indicate a significant increase in MAP2-expressing cells only in ASD cultures treated with DOTAP-miR-1290. Bar = 20 μm. ∗∗ P < 0.001 (n = 3 donors), determined by two-way ANOVA followed by Sidak's multiple correction test. Data are represented as the mean ± SEM.
Figure 5
Figure 5
Enriched GO terms (in “cellular process” category) corresponding to 67 target genes associated with ASD. (a) Pie chart representing broad functional groups. The size of each category within a pie chart represents the percent of included terms. All enriched GO terms are statistically significant (P value < 0.01). Single and double asterisks indicate significant enriched GO terms at the group with P value = 0.01 and the group with P value < 0.01, respectively. (b) Networks of functional groups (shown in 5A) with matching color coding. Nodes with kappa score ≥ 0.6, where only the label of the most significant term per functional group is shown. Color-filled large circles represent GO terms, and the circle size represents their enrichment significance. Tiny circles with red text label represent genes associated with one or multiple GO terms. All enriched GO terms shown in the network are statistically significant with a Benjamini-Hochberg corrected P value of <0.01. These results are also shown in Table S2 under column “F.”
Figure 6
Figure 6
Genes involved in different developmental processes are highlighted over the 67 target genes associated with ASD, using an Ingenuity Pathway Analysis (IPA) tool. (a) Embryonic development. (b) Nervous system development and function. (c) Organismal development. (d) Behavior.

Similar articles

Cited by

References

    1. Kim H. J., Rosenfeld M. G. Epigenetic control of stem cell fate to neurons and glia. Archives of Pharmacal Research. 2010;33(10):1467–1473. doi: 10.1007/s12272-010-1001-z. - DOI - PubMed
    1. Berezikov E., Thuemmler F., van Laake L. W., et al. Diversity of microRNAs in human and chimpanzee brain. Nature Genetics. 2006;38(12):1375–1377. doi: 10.1038/ng1914. - DOI - PubMed
    1. Koufaris C. Human and primate-specific microRNAs in cancer: evolution, and significance in comparison with more distantly-related research models: the great potential of evolutionary young microRNA in cancer research. BioEssays. 2016;38(3):286–294. doi: 10.1002/bies.201500135. - DOI - PubMed
    1. Yelamanchili S. V., Morsey B., Harrison E. B., et al. The evolutionary young miR-1290 favors mitotic exit and differentiation of human neural progenitors through altering the cell cycle proteins. Cell Death & Disease. 2014;5(1):p. e982. doi: 10.1038/cddis.2013.498. - DOI - PMC - PubMed
    1. Mariani J., Coppola G., Zhang P., et al. FOXG1-dependent dysregulation of GABA/glutamate neuron differentiation in autism spectrum disorders. Cell. 2015;162(2):375–390. doi: 10.1016/j.cell.2015.06.034. - DOI - PMC - PubMed

LinkOut - more resources