

Harnessing 13C-labeled myo-inositol to interrogate inositol phosphate messengers by NMR
- PMID: 31191882
- PMCID: PMC6540952
- DOI: 10.1039/c9sc00151d
Harnessing 13C-labeled myo-inositol to interrogate inositol phosphate messengers by NMR
Abstract
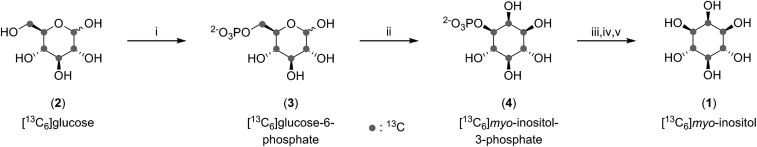
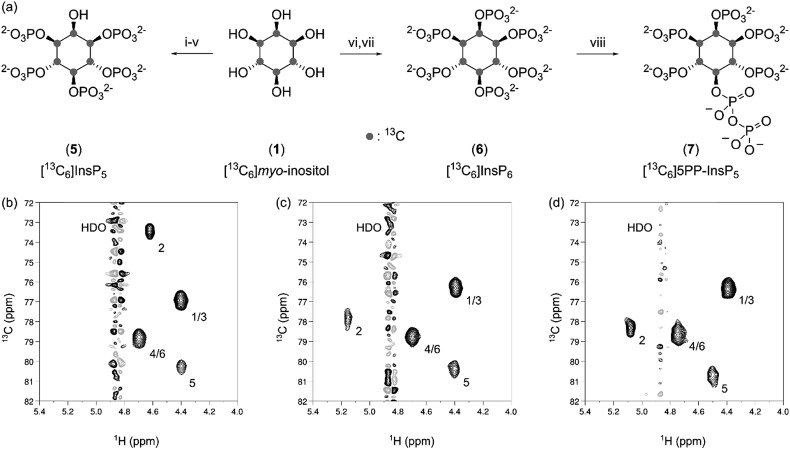
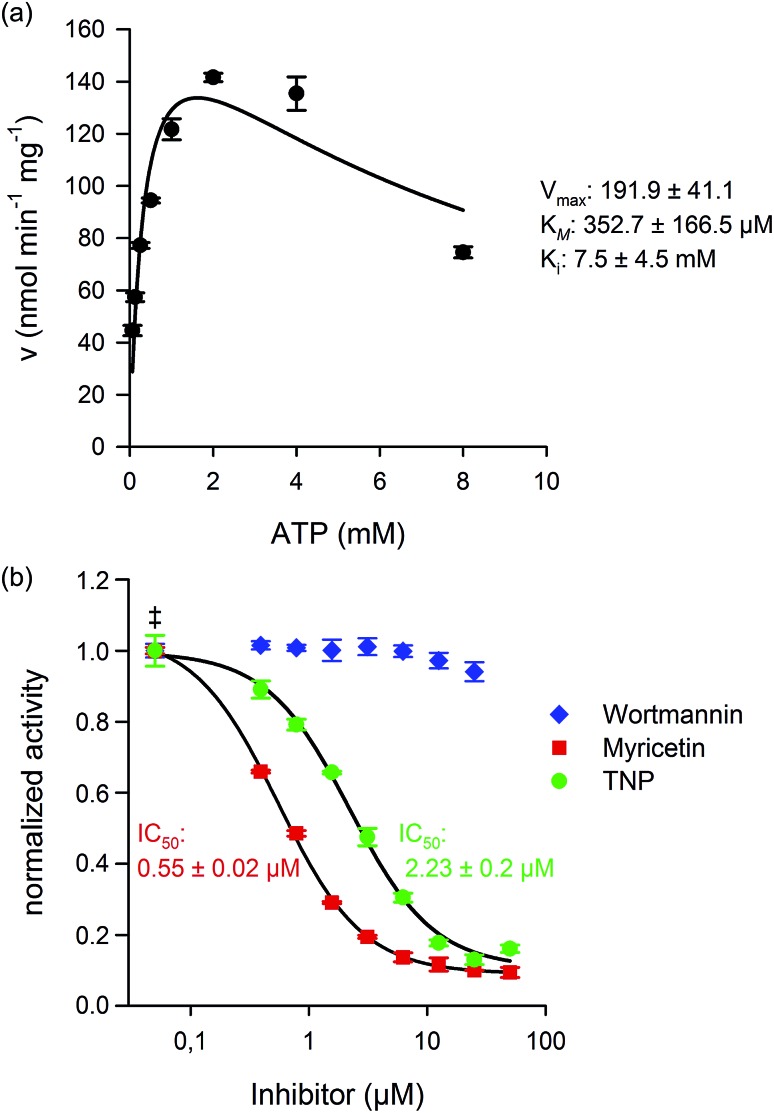
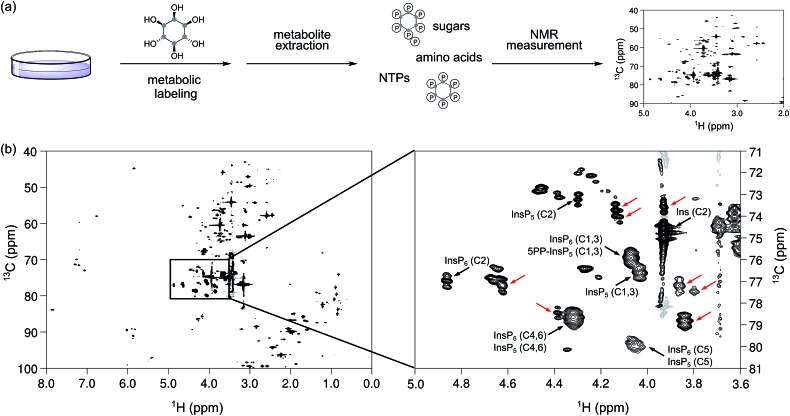
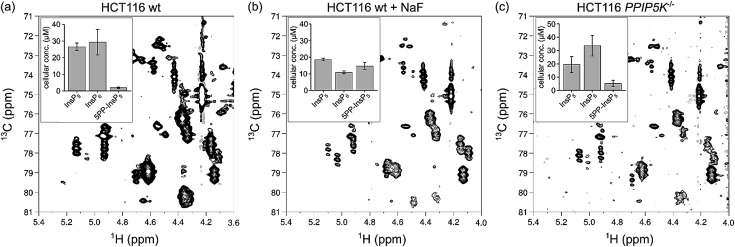
Inositol poly- and pyrophosphates (InsPs and PP-InsPs) are an important group of metabolites and mediate a wide range of processes in eukaryotic cells. To elucidate the functions of these molecules, robust techniques for the characterization of inositol phosphate metabolism are required, both at the biochemical and the cellular level. Here, a new tool-set is reported, which employs uniformly 13C-labeled compounds ([13C6]myo-inositol, [13C6]InsP5, [13C6]InsP6, and [13C6]5PP-InsP5), in combination with commonly accessible NMR technology. This approach permitted the detection and quantification of InsPs and PP-InsPs within complex mixtures and at physiological concentrations. Specifically, the enzymatic activity of IP6K1 could be monitored in vitro in real time. Metabolic labeling of mammalian cells with [13C6]myo-inositol enabled the analysis of cellular pools of InsPs and PP-InsPs, and uncovered high concentrations of 5PP-InsP5 in HCT116 cells, especially in response to genetic and pharmacological perturbation. The reported method greatly facilitates the analysis of this otherwise spectroscopically silent group of molecules, and holds great promise to comprehensively analyze inositol-based signaling molecules under normal and pathological conditions.
Figures

Similar articles
-
Functions, Mechanisms, and therapeutic applications of the inositol pyrophosphates 5PP-InsP5 and InsP8 in mammalian cells.J Cardiovasc Transl Res. 2024 Feb;17(1):197-215. doi: 10.1007/s12265-023-10427-0. Epub 2023 Aug 24. J Cardiovasc Transl Res. 2024. PMID: 37615888 Review.
-
Scalable Chemoenzymatic Synthesis of Inositol Pyrophosphates.Biochemistry. 2019 Sep 24;58(38):3927-3932. doi: 10.1021/acs.biochem.9b00587. Epub 2019 Sep 14. Biochemistry. 2019. PMID: 31461621
-
Analysis of metabolically labeled inositol phosphate messengers by NMR.Methods Enzymol. 2020;641:35-52. doi: 10.1016/bs.mie.2020.04.035. Epub 2020 Jun 12. Methods Enzymol. 2020. PMID: 32713530
-
Analysis of inositol phosphate metabolism by capillary electrophoresis electrospray ionization mass spectrometry.Nat Commun. 2020 Nov 27;11(1):6035. doi: 10.1038/s41467-020-19928-x. Nat Commun. 2020. PMID: 33247133 Free PMC article.
-
Biosynthesis and possible functions of inositol pyrophosphates in plants.Front Plant Sci. 2015 Feb 12;6:67. doi: 10.3389/fpls.2015.00067. eCollection 2015. Front Plant Sci. 2015. PMID: 25729385 Free PMC article. Review.
Cited by
-
Inositol phosphate kinases in the eukaryote landscape.Adv Biol Regul. 2021 Jan;79:100782. doi: 10.1016/j.jbior.2020.100782. Epub 2020 Dec 29. Adv Biol Regul. 2021. PMID: 33422459 Free PMC article.
-
Protein pyrophosphorylation by inositol phosphates: a novel post-translational modification in plants?Front Plant Sci. 2024 Feb 22;15:1347922. doi: 10.3389/fpls.2024.1347922. eCollection 2024. Front Plant Sci. 2024. PMID: 38455731 Free PMC article. Review.
-
The phytase RipBL1 enables the assignment of a specific inositol phosphate isomer as a structural component of human kidney stones.RSC Chem Biol. 2023 Jan 27;4(4):300-309. doi: 10.1039/d2cb00235c. eCollection 2023 Apr 5. RSC Chem Biol. 2023. PMID: 37034402 Free PMC article.
-
Tandem inactivation of inositol pyrophosphatases Asp1, Siw14, and Aps1 illuminates functional redundancies in inositol pyrophosphate catabolism in fission yeast.mBio. 2025 May 14;16(5):e0038925. doi: 10.1128/mbio.00389-25. Epub 2025 Apr 16. mBio. 2025. PMID: 40237466 Free PMC article.
-
Development of isotope-enriched phosphatidylinositol-4- and 5-phosphate cellular mass spectrometry probes.Chem Sci. 2020 Dec 28;12(7):2549-2557. doi: 10.1039/d0sc06219g. eCollection 2021 Feb 21. Chem Sci. 2020. PMID: 34820112 Free PMC article.
References
Grants and funding
LinkOut - more resources
Full Text Sources
Other Literature Sources
Miscellaneous