

Development of the circumduction metric for identification of cervical motion impairment
- PMID: 31191942
- PMCID: PMC6453104
- DOI: 10.1177/2055668318777984
Development of the circumduction metric for identification of cervical motion impairment
Abstract
Introduction: Chronic neck pain results in considerable personal, clinical, and societal burden. It consistently ranks among the top three pain-related reasons for seeking healthcare. Despite its prevalence, neck pain is difficult to both assess and treat. Quantitative approaches are required since diagnostic imaging techniques rarely provide information on movement-related neck pain, and most common clinical assessment tools are limited to single plane motion measurement.
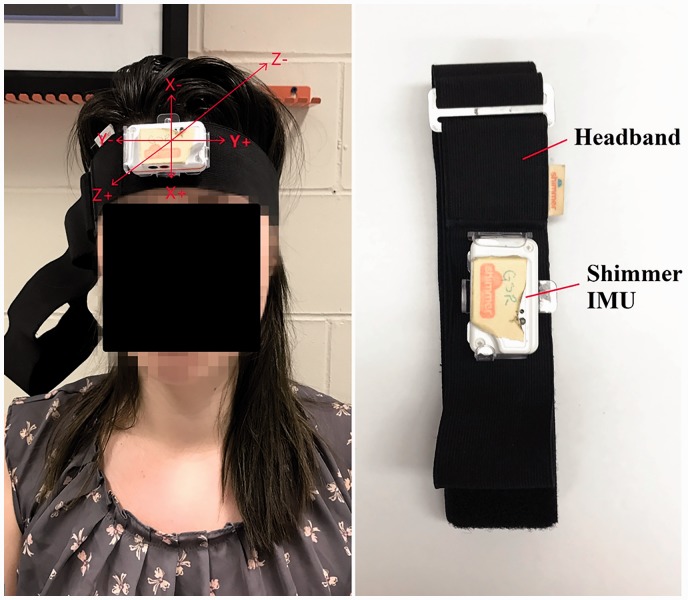
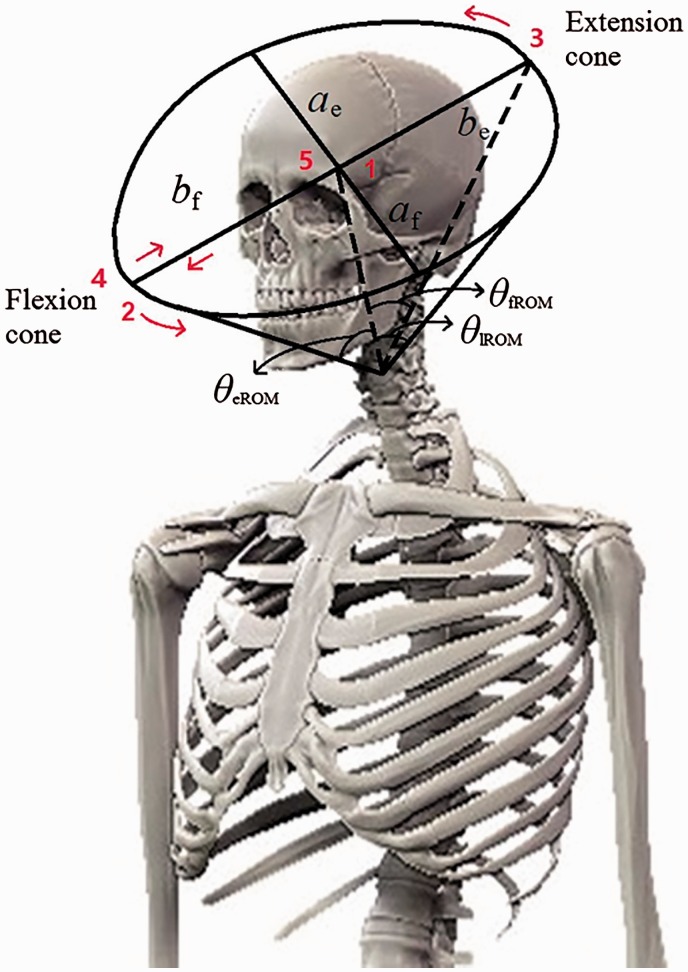
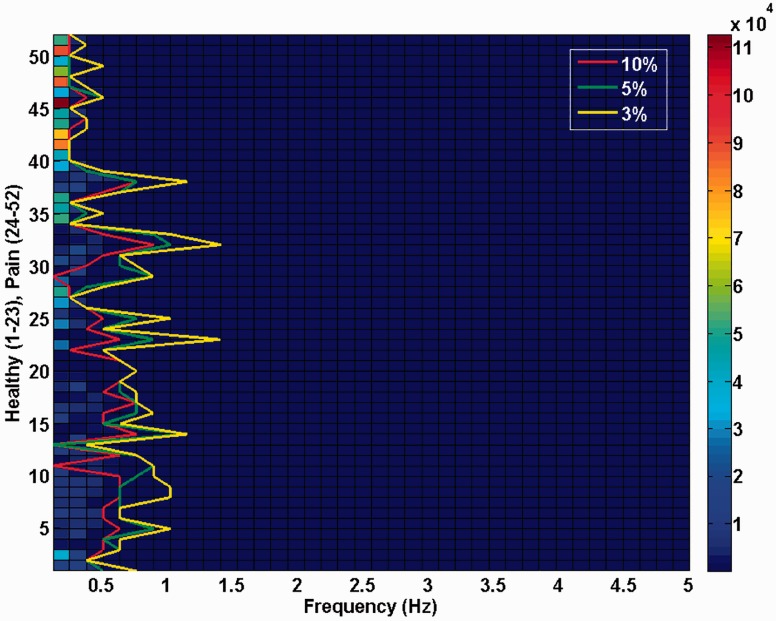
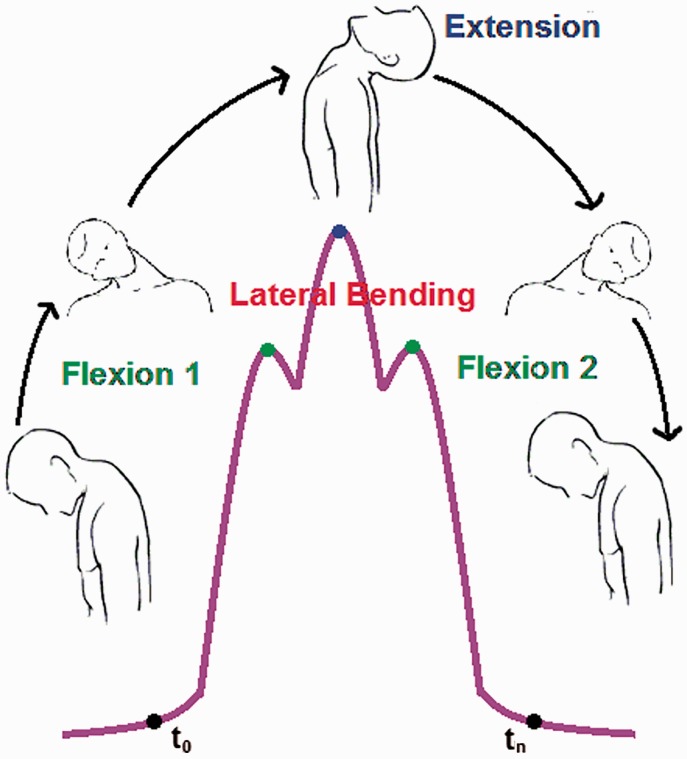
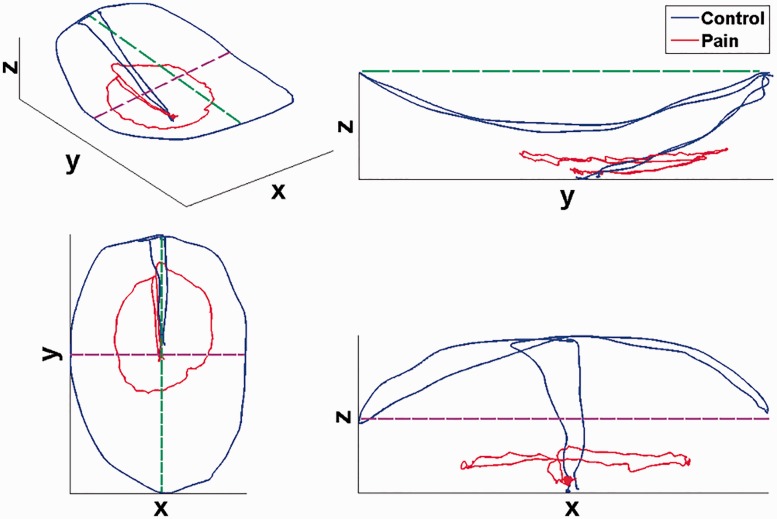
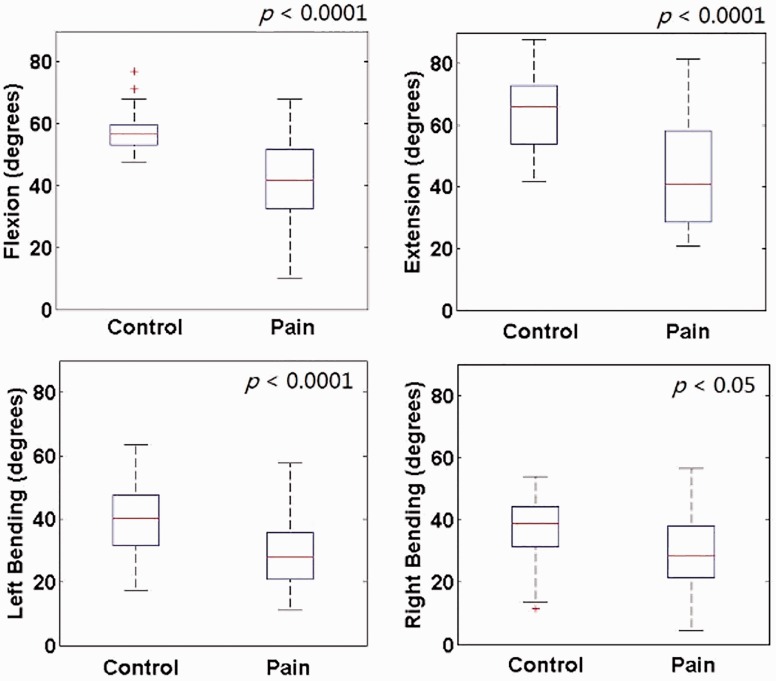
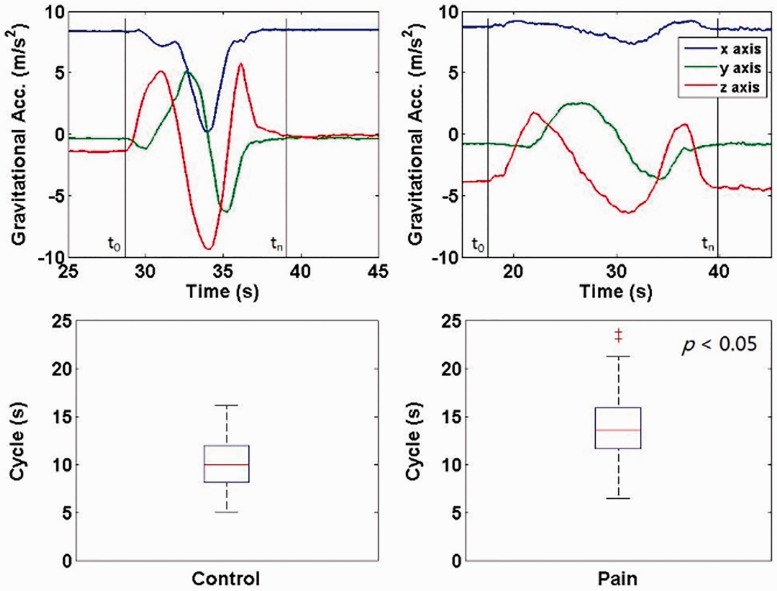
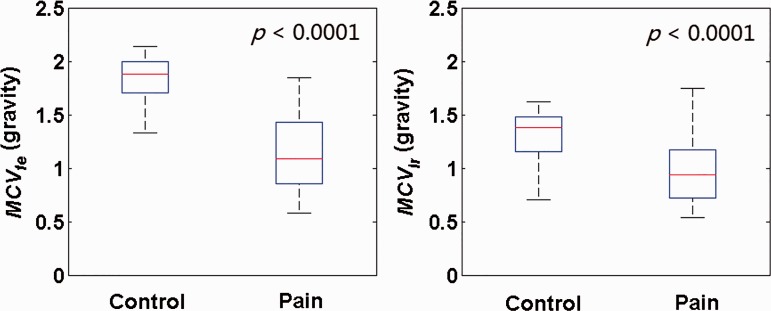
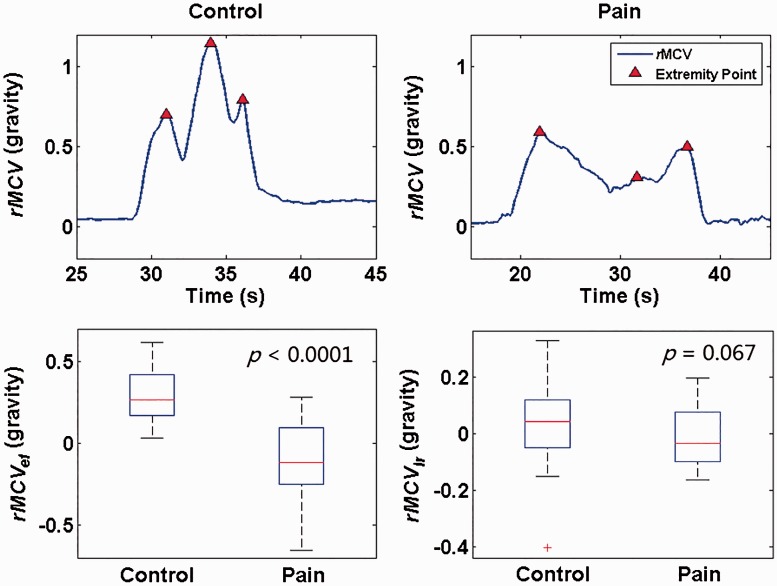
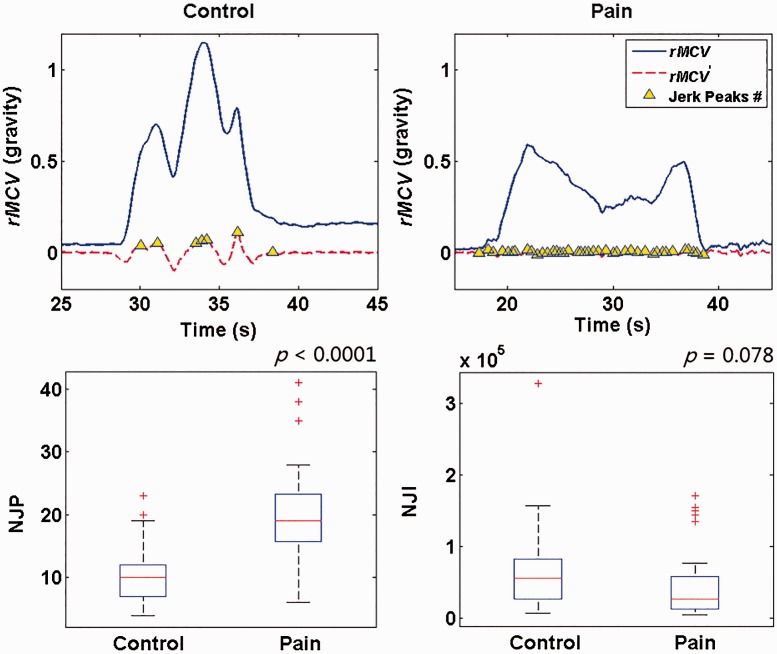
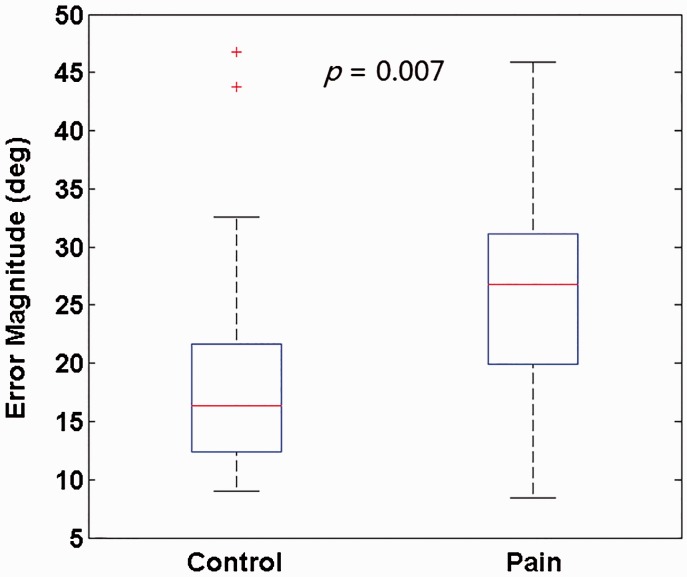
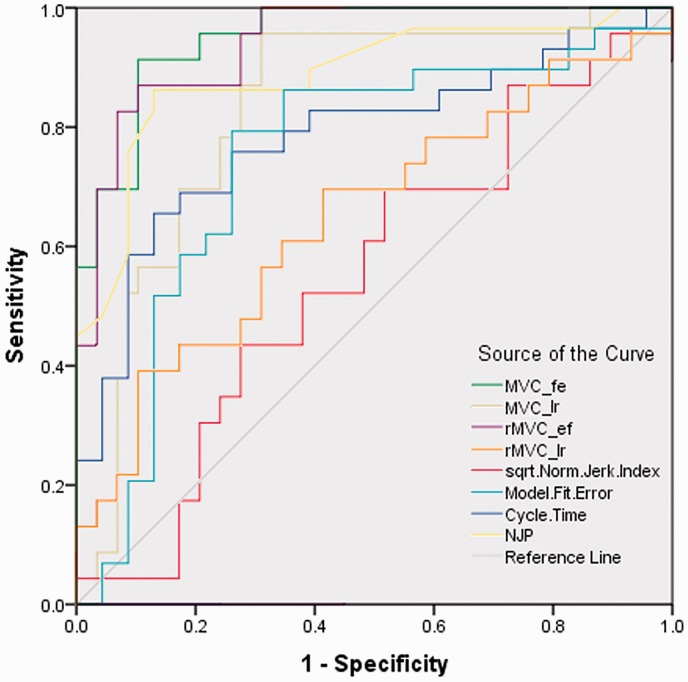
Methods: In this study, the ability of an inertial measurement unit to document the cervical motion characteristics of 28 people with chronic neck pain and 23 healthy controls was assessed. A total of six circumduction metrics and one neck circumduction trajectory model were proposed as identification metrics.
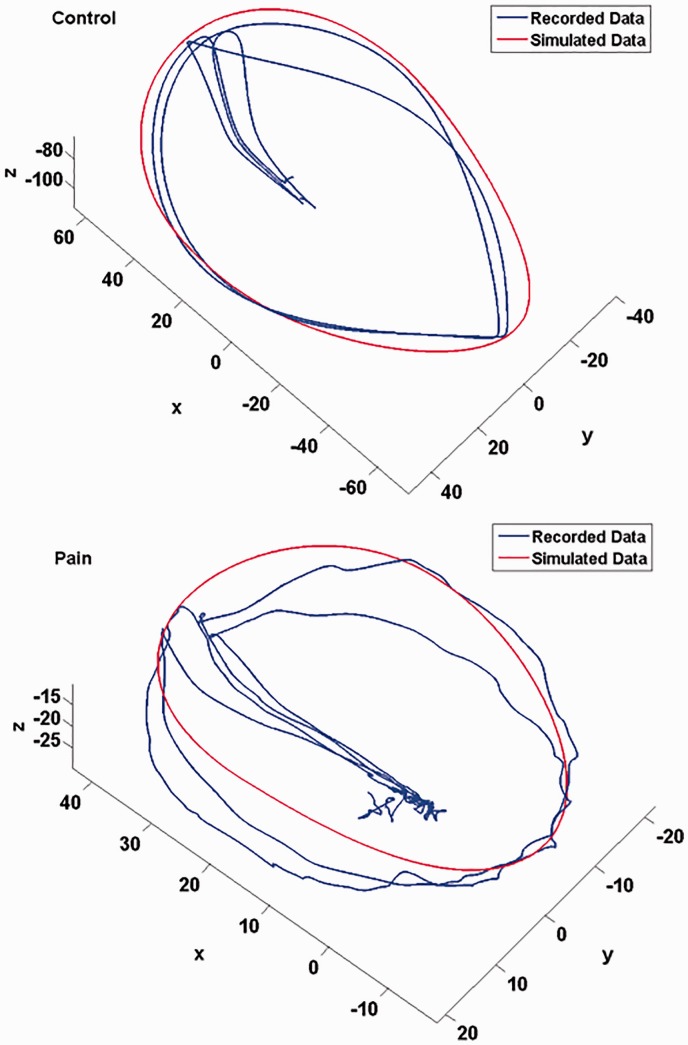
Results: Five metrics demonstrated significant differences between the two groups. The neck circumduction trajectory model successfully distinguished between the two groups.
Discussion: The evaluation of the proposed metrics provides proof of concept that novel metrics can be captured with relative ease in the clinical setting using an inexpensive wearable sensor headband. The derivation of the proposed model may open new lines of inquiry into the clinical utility of assessing the multiplanar movement of cervical circumduction. The results obtained from this study also provide additional insight for the development of a sensitive, quantifiable and real-world neck evaluation strategies.
Keywords: Chronic neck pain; cervical circumduction evaluation; cervical circumduction metric; cervical motion impairment; cervical position; neck circumduction trajectory model.
Conflict of interest statement
The author(s) declared no potential conflicts of interest with respect to the research, authorship, and/or publication of this article.
Figures
Similar articles
-
Normative cervical spine kinematics of a circumduction task.J Electromyogr Kinesiol. 2021 Dec;61:102591. doi: 10.1016/j.jelekin.2021.102591. Epub 2021 Sep 8. J Electromyogr Kinesiol. 2021. PMID: 34543984 Free PMC article.
-
Instantaneous helical axis methodology to identify aberrant neck motion.Clin Biomech (Bristol). 2013 Aug;28(7):731-5. doi: 10.1016/j.clinbiomech.2013.07.006. Epub 2013 Aug 2. Clin Biomech (Bristol). 2013. PMID: 23911108 Free PMC article.
-
Developing functional workspace for the movement of trunk circumduction in healthy young subjects: a reliability study.Biomed Eng Online. 2013 Jan 11;12:4. doi: 10.1186/1475-925X-12-4. Biomed Eng Online. 2013. PMID: 23311750 Free PMC article.
-
Differences in the kinematics of the cervical and thoracic spine during functional movement in individuals with or without chronic neck pain: a systematic review.Physiotherapy. 2019 Dec;105(4):421-433. doi: 10.1016/j.physio.2019.01.007. Epub 2019 Jan 21. Physiotherapy. 2019. PMID: 31005251
-
Electronic measures of movement impairment, repositioning, and posture in people with and without neck pain-a systematic review.Syst Rev. 2019 Aug 27;8(1):220. doi: 10.1186/s13643-019-1125-2. Syst Rev. 2019. PMID: 31455393 Free PMC article.
Cited by
-
Paravertebral Muscle Mechanical Properties and Spinal Range of Motion in Patients with Acute Neck or Low Back Pain: A Case-Control Study.Diagnostics (Basel). 2021 Feb 20;11(2):352. doi: 10.3390/diagnostics11020352. Diagnostics (Basel). 2021. PMID: 33672470 Free PMC article.
-
Head kinematics in patients with neck pain compared to asymptomatic controls: a systematic review.BMC Musculoskelet Disord. 2022 Feb 16;23(1):156. doi: 10.1186/s12891-022-05097-z. BMC Musculoskelet Disord. 2022. PMID: 35172799 Free PMC article.
-
Kinematics of the Cervical Spine Under Healthy and Degenerative Conditions: A Systematic Review.Ann Biomed Eng. 2022 Dec;50(12):1705-1733. doi: 10.1007/s10439-022-03088-8. Epub 2022 Dec 10. Ann Biomed Eng. 2022. PMID: 36496482 Free PMC article.
-
Normative cervical spine kinematics of a circumduction task.J Electromyogr Kinesiol. 2021 Dec;61:102591. doi: 10.1016/j.jelekin.2021.102591. Epub 2021 Sep 8. J Electromyogr Kinesiol. 2021. PMID: 34543984 Free PMC article.
-
Torsional nystagmus and otolith dumping effects investigated by head circumduction.J Neurophysiol. 2025 Apr 1;133(4):1295-1306. doi: 10.1152/jn.00570.2024. Epub 2025 Mar 28. J Neurophysiol. 2025. PMID: 40152321 Free PMC article.
References
-
- Hogg-Johnson S, van der Velde G, Carroll LJ, et al. The burden and determinants of neck pain in the general population: results of the bone and joint decade 2000–2010 task force on neck pain and its associated disorders. J Manipulative Physiol Ther 2008; 33: S46–S60. - PubMed
-
- Hoy D, March L, Woolf A, et al. The global burden of neck pain: estimates from the global burden of disease 2010 study. Ann Rheum Dis 2014; 73: 1309–1315. - PubMed
-
- van der Velde G, Yu H, Paulden M, et al. Which interventions are cost-effective for the management of whiplash-associated and neck pain-associated disorders? A systematic review of the health economic literature by the Ontario Protocol for Traffic Injury Management (OPTIMa) Collaboration. Spine J 2016; 16: 1582–1597. - PubMed
LinkOut - more resources
Full Text Sources
