

Entrainment of Circadian Rhythms to Temperature Reveals Amplitude Deficits in Fibroblasts from Patients with Bipolar Disorder and Possible Links to Calcium Channels
- PMID: 31192224
- PMCID: PMC6528084
- DOI: 10.1159/000497354
Entrainment of Circadian Rhythms to Temperature Reveals Amplitude Deficits in Fibroblasts from Patients with Bipolar Disorder and Possible Links to Calcium Channels
Abstract
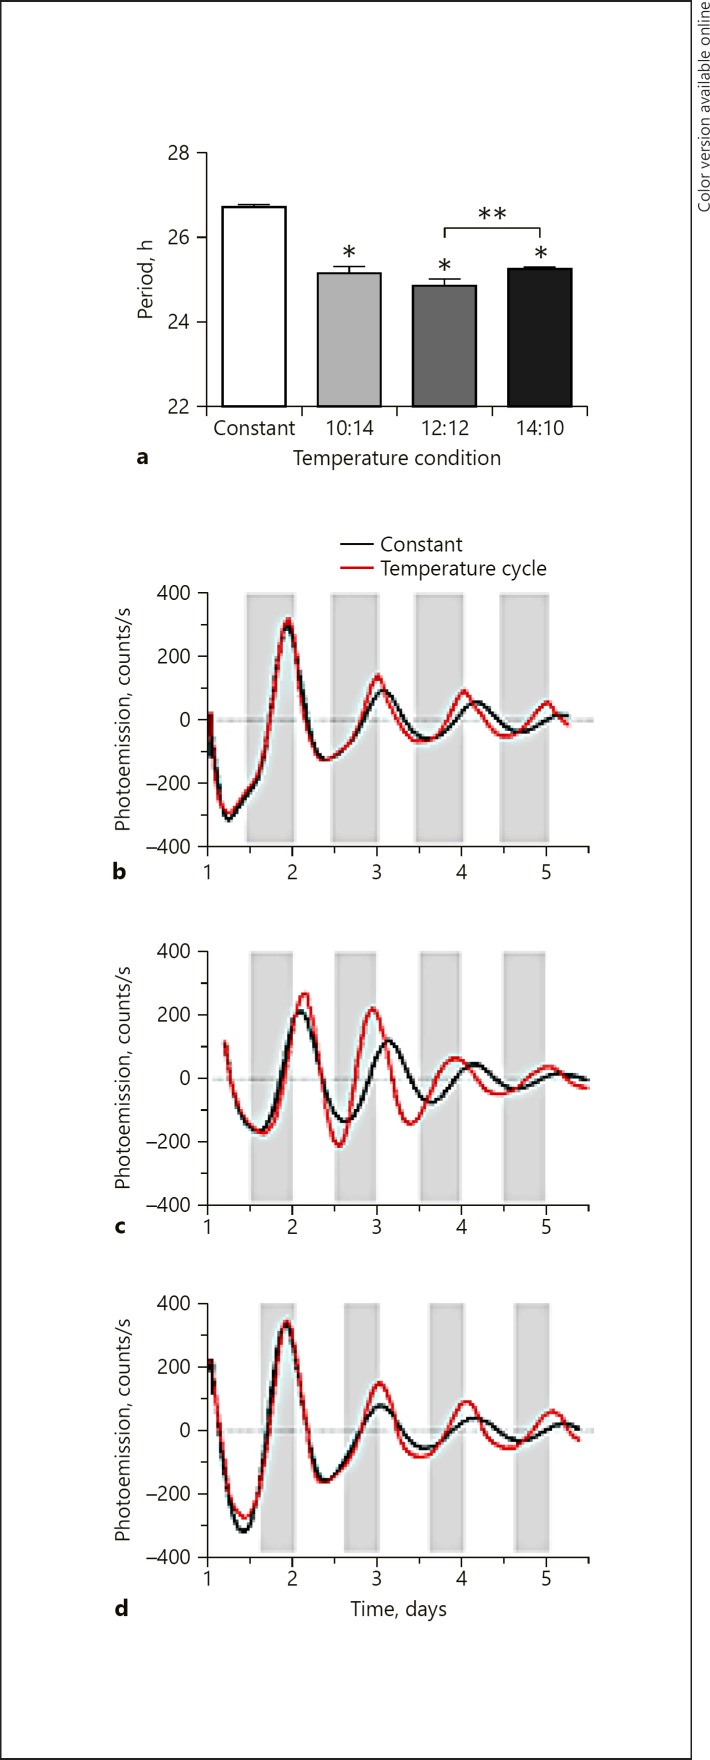
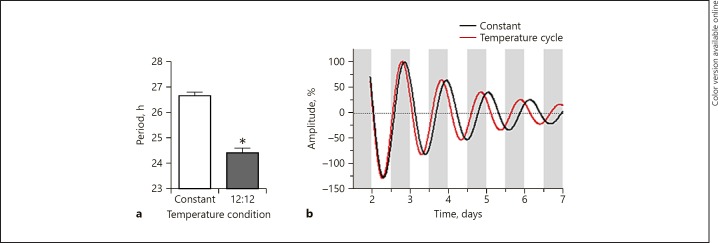
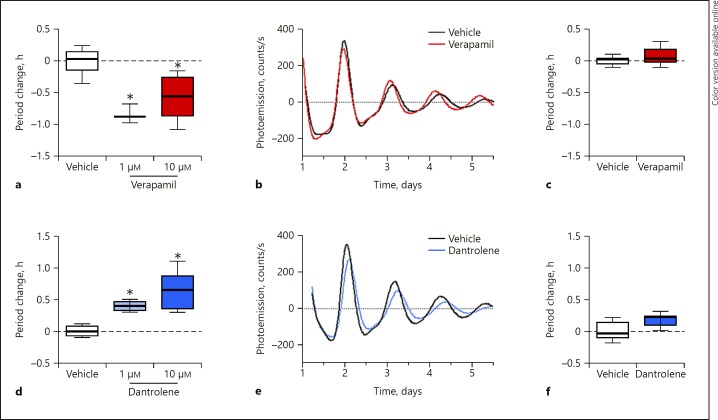
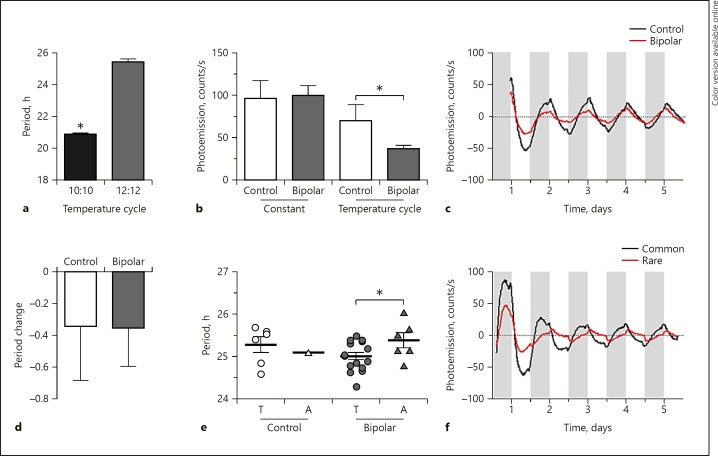
Bipolar disorder (BD) is characterized by recurrent mood episodes, and circadian rhythm disturbances. Past studies have identified calcium channel genes as risk loci for BD. CACNA1C encodes an L-type calcium channel (LTCC) involved in the entrainment of circadian rhythms to light. Another calcium channel, i.e., the ryanodine receptor (RYR), is involved in -circadian phase delays. It is unknown whether variants in CACNA1C or other calcium channels contribute to the circadian phenotype in BD. We hypothesized that, by using temperature cycles, we could model circadian entrainment in fibroblasts from BD patients and controls to interrogate the circadian functions of LTCCs. Using Per2-luc, a bioluminescent reporter, we verified that cells entrain to temperature rhythms in vitro. Under constant temperature conditions, the LTCC antagonist verapamil shortened the circadian period, and the RYR antagonist dantrolene lengthened the period. However, neither drug affected temperature entrainment. Fibroblasts from BD patients and controls also entrained to temperature. In cells from BD patients, the rhythm amplitude was lower under entrained, but not constant, conditions. Temperature entrainment was otherwise similar between BD and control cells. However, the CACNA1C genotype among BD cells predicted the degree to which cells entrained. We conclude that assessment of rhythms under entrained conditions reveals additional rhythm abnormalities in BD that are not observable under constant temperature conditions.
Keywords: Bipolar disorder; Calcium channel; Circadian rhythm; Gene expression.
Figures
Similar articles
-
Circadian rhythms in bipolar disorder patient-derived neurons predict lithium response: preliminary studies.Mol Psychiatry. 2021 Jul;26(7):3383-3394. doi: 10.1038/s41380-021-01048-7. Epub 2021 Mar 5. Mol Psychiatry. 2021. PMID: 33674753 Free PMC article.
-
Calcium channel genes associated with bipolar disorder modulate lithium's amplification of circadian rhythms.Neuropharmacology. 2016 Feb;101:439-48. doi: 10.1016/j.neuropharm.2015.10.017. Epub 2015 Oct 22. Neuropharmacology. 2016. PMID: 26476274 Free PMC article.
-
Genetic and clinical factors predict lithium's effects on PER2 gene expression rhythms in cells from bipolar disorder patients.Transl Psychiatry. 2013 Oct 22;3(10):e318. doi: 10.1038/tp.2013.90. Transl Psychiatry. 2013. PMID: 24150227 Free PMC article.
-
Temperature effect on entrainment, phase shifting, and amplitude of circadian clocks and its molecular bases.Chronobiol Int. 2002 Sep;19(5):807-64. doi: 10.1081/cbi-120014569. Chronobiol Int. 2002. PMID: 12405549 Review.
-
Missing a beat: assessment of circadian rhythm abnormalities in bipolar disorder in the genomic era.Psychiatr Genet. 2019 Apr;29(2):29-36. doi: 10.1097/YPG.0000000000000215. Psychiatr Genet. 2019. PMID: 30516584 Review.
Cited by
-
Circadian rhythms in bipolar disorder patient-derived neurons predict lithium response: preliminary studies.Mol Psychiatry. 2021 Jul;26(7):3383-3394. doi: 10.1038/s41380-021-01048-7. Epub 2021 Mar 5. Mol Psychiatry. 2021. PMID: 33674753 Free PMC article.
-
Sleep and Memory Consolidation Dysfunction in Psychiatric Disorders: Evidence for the Involvement of Extracellular Matrix Molecules.Front Neurosci. 2021 May 14;15:646678. doi: 10.3389/fnins.2021.646678. eCollection 2021. Front Neurosci. 2021. PMID: 34054408 Free PMC article. Review.
-
Differentially Altered Metabolic Pathways in the Amygdala of Subjects with Schizophrenia, Bipolar Disorder and Major Depressive Disorder.medRxiv [Preprint]. 2024 Apr 19:2024.04.17.24305854. doi: 10.1101/2024.04.17.24305854. medRxiv. 2024. Update in: Schizophr Bull. 2024 Nov 11:sbae193. doi: 10.1093/schbul/sbae193. PMID: 38699334 Free PMC article. Updated. Preprint.
-
Rare Homozygous Variants in INSR and NFXL1 Are Associated with Severe Treatment-Resistant Psychosis.Int J Mol Sci. 2025 May 21;26(10):4925. doi: 10.3390/ijms26104925. Int J Mol Sci. 2025. PMID: 40430072 Free PMC article.
-
Mathematical modeling of temperature-induced circadian rhythms.Front Syst Biol. 2024 Mar 25;4:1256398. doi: 10.3389/fsysb.2024.1256398. eCollection 2024. Front Syst Biol. 2024. PMID: 40809122 Free PMC article.
References
-
- McGuffin P, Rijsdijk F, Andrew M, Sham P, Katz R, Cardno A. The heritability of bipolar affective disorder and the genetic relationship to unipolar depression. Arch Gen Psychiatry. 2003 May;60((5)):497–502. - PubMed
