

A meta-analysis of procedures to change implicit measures
- PMID: 31192631
- PMCID: PMC6687518
- DOI: 10.1037/pspa0000160
A meta-analysis of procedures to change implicit measures
Abstract
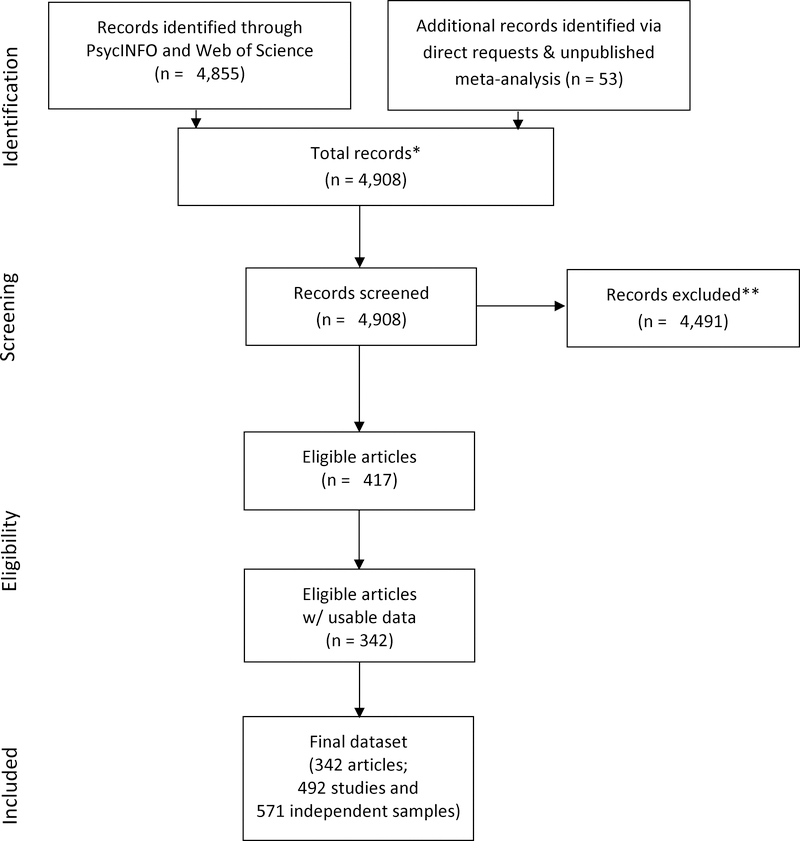
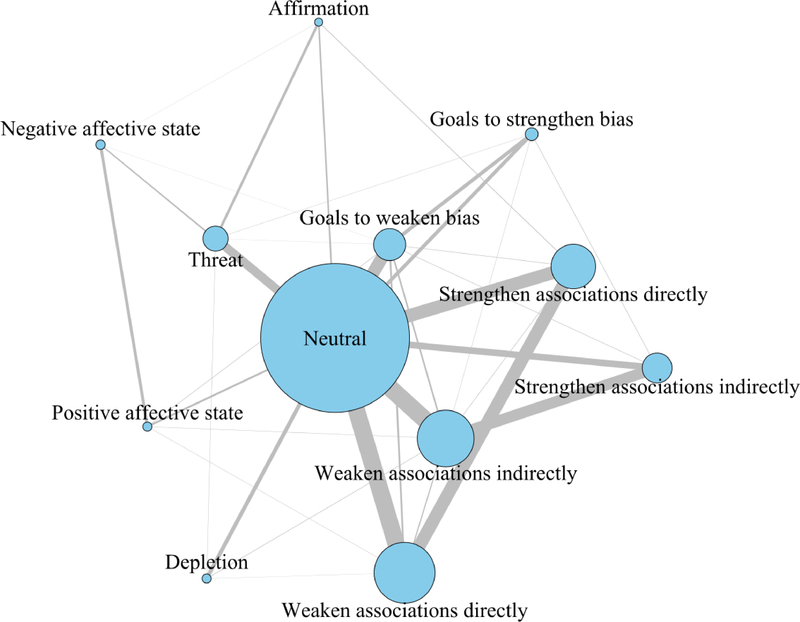
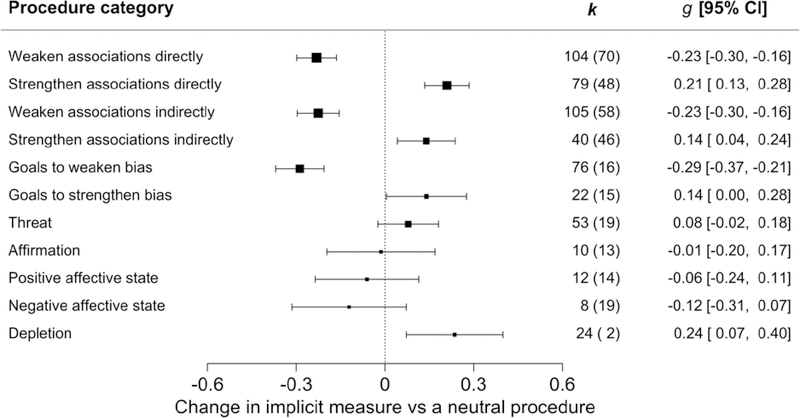
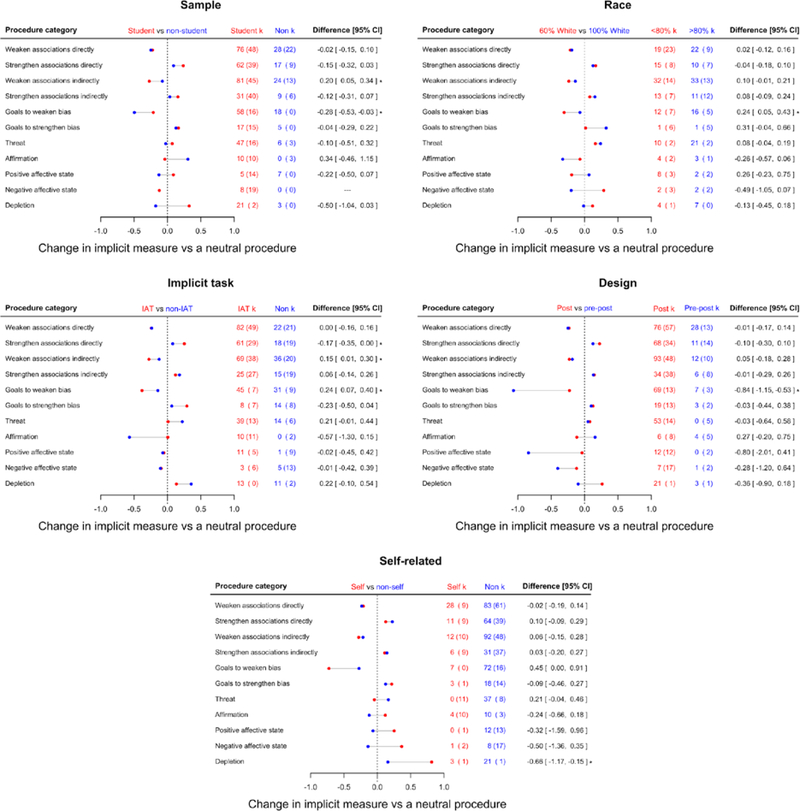
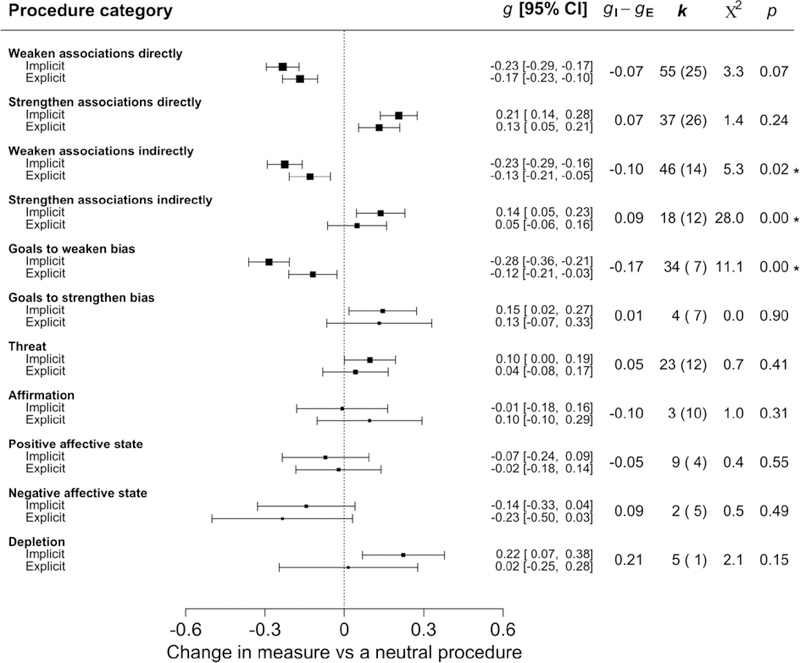
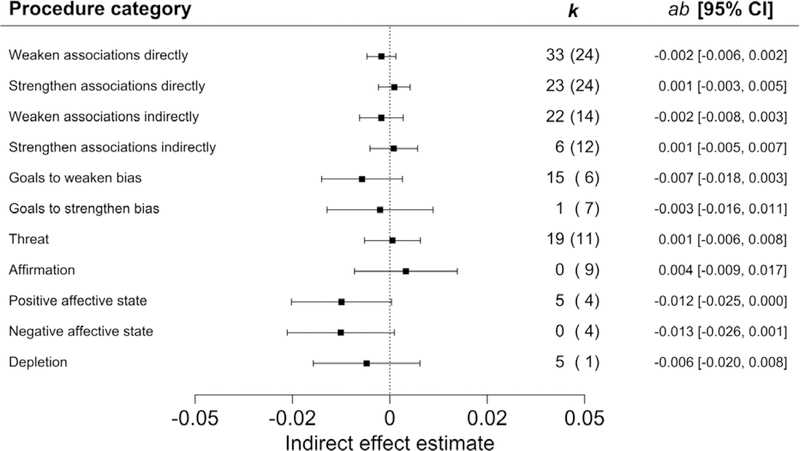
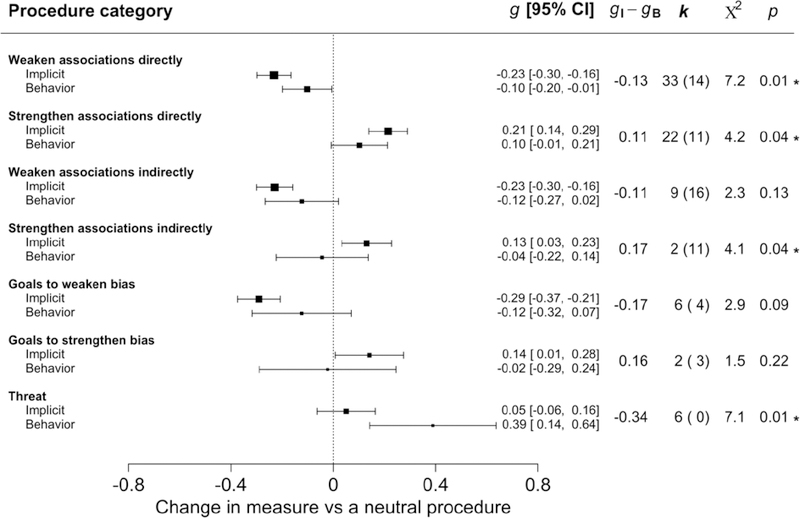
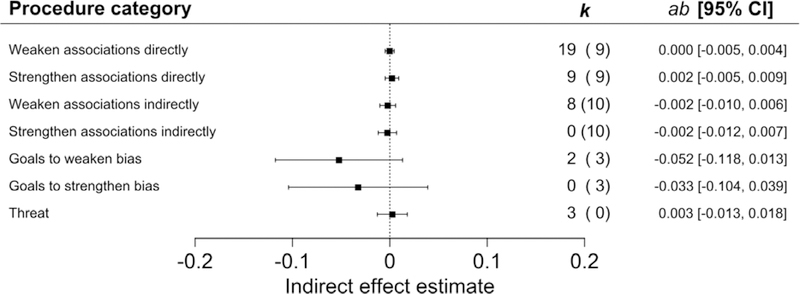
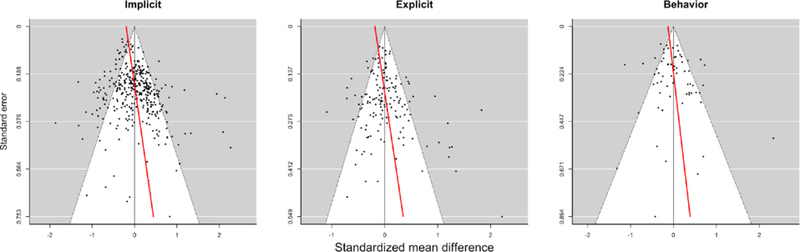
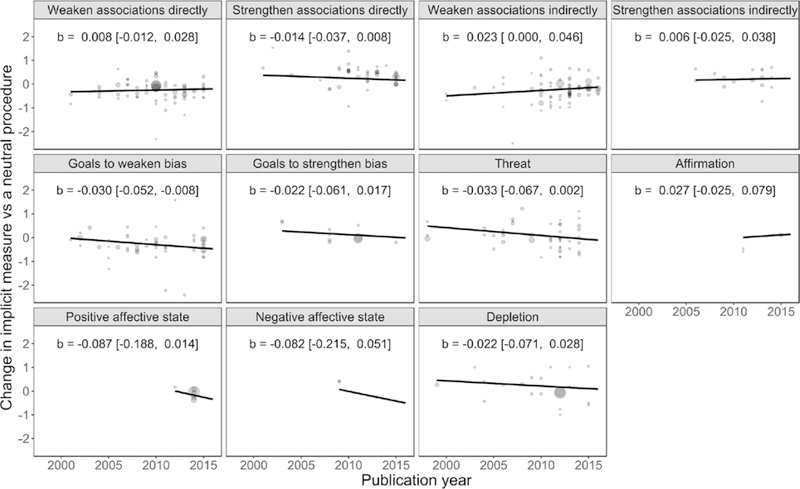
Using a novel technique known as network meta-analysis, we synthesized evidence from 492 studies (87,418 participants) to investigate the effectiveness of procedures in changing implicit measures, which we define as response biases on implicit tasks. We also evaluated these procedures' effects on explicit and behavioral measures. We found that implicit measures can be changed, but effects are often relatively weak (|ds| < .30). Most studies focused on producing short-term changes with brief, single-session manipulations. Procedures that associate sets of concepts, invoke goals or motivations, or tax mental resources changed implicit measures the most, whereas procedures that induced threat, affirmation, or specific moods/emotions changed implicit measures the least. Bias tests suggested that implicit effects could be inflated relative to their true population values. Procedures changed explicit measures less consistently and to a smaller degree than implicit measures and generally produced trivial changes in behavior. Finally, changes in implicit measures did not mediate changes in explicit measures or behavior. Our findings suggest that changes in implicit measures are possible, but those changes do not necessarily translate into changes in explicit measures or behavior. (PsycINFO Database Record (c) 2019 APA, all rights reserved).
Figures
Similar articles
-
Relationship between the Implicit Association Test and intergroup behavior: A meta-analysis.Am Psychol. 2019 Jul-Aug;74(5):569-586. doi: 10.1037/amp0000364. Epub 2018 Dec 13. Am Psychol. 2019. PMID: 30550298
-
On the effectiveness of approach-avoidance instructions and training for changing evaluations of social groups.J Pers Soc Psychol. 2020 Aug;119(2):e1-e14. doi: 10.1037/pspa0000189. Epub 2020 Mar 9. J Pers Soc Psychol. 2020. PMID: 32150429
-
Implicit bias toward people with disability: A systematic review and meta-analysis.Rehabil Psychol. 2023 May;68(2):121-134. doi: 10.1037/rep0000493. Epub 2023 Apr 20. Rehabil Psychol. 2023. PMID: 37079819
-
Why do implicit and explicit attitude tests diverge? The role of structural fit.J Pers Soc Psychol. 2008 Jan;94(1):16-31. doi: 10.1037/0022-3514.94.1.16. J Pers Soc Psychol. 2008. PMID: 18179315 Clinical Trial.
-
Implicit measures of association in psychopathology research.Psychol Bull. 2011 Jan;137(1):149-193. doi: 10.1037/a0021729. Psychol Bull. 2011. PMID: 21219060 Review.
Cited by
-
Applied Racial/Ethnic Healthcare Disparities Research Using Implicit Measures.Soc Cogn. 2020 Nov;38(Suppl):s68-s97. doi: 10.1521/soco.2020.38.supp.s68. Epub 2020 Dec 1. Soc Cogn. 2020. PMID: 34103783 Free PMC article.
-
Space-valence mapping of social concepts: Do we arrange negative and positive ethnic stereotypes from left to right?Front Psychol. 2022 Dec 9;13:1070177. doi: 10.3389/fpsyg.2022.1070177. eCollection 2022. Front Psychol. 2022. PMID: 36571035 Free PMC article.
-
Interventions designed to reduce implicit prejudices and implicit stereotypes in real world contexts: a systematic review.BMC Psychol. 2019 May 16;7(1):29. doi: 10.1186/s40359-019-0299-7. BMC Psychol. 2019. PMID: 31097028 Free PMC article.
-
Smartphone-Based Virtual and Augmented Reality Implicit Association Training (VARIAT) for Reducing Implicit Biases Toward Patients Among Health Care Providers: App Development and Pilot Testing.JMIR Serious Games. 2024 Mar 7;12:e51310. doi: 10.2196/51310. JMIR Serious Games. 2024. PMID: 38488662 Free PMC article.
-
Racial Implicit Bias and Communication Among Physicians in a Simulated Environment.JAMA Netw Open. 2024 Mar 4;7(3):e242181. doi: 10.1001/jamanetworkopen.2024.2181. JAMA Netw Open. 2024. PMID: 38506811 Free PMC article.
References
-
-
Abedi FH, Noorbala F, & Saeedi Z (2010). Stereotypical beliefs about sex role-typed occupations and the mediating effect of exposure to counterstereotypic examples in Iranian students. Procedia Social and Behavioral Sciences, 5, 1425–1428.
* Contains data used in the meta-analysis.
-
-
-
Agustin AA, & Francisco VGJ (2008). Analysing the effects of mortality salience on prejudice and decision-taking In Olson FM (Ed.), New Developments in the Psychology of Motivation (pp. 53–65). Nova Science Publishers.
* Contains data used in the meta-analysis.
-
-
- Albertson BL (2011). Religious appeals and implicit attitudes. Political Psychology, 32, 109–130.
-
-
Allen TJ, Sherman JW, Conrey FR, & Stroessner SJ (2009). Stereotype strength and attentional bias: Preference for confirming versus disconfirming information depends on processing capacity. Journal of Experimental Social Psychology, 45, 1081–1087.
* Contains data used in the meta-analysis.
-
Publication types
MeSH terms
Grants and funding
LinkOut - more resources
Full Text Sources
Medical
