

Computer analysis of the sensory qualities of red wines as a method to optimize their blend formulation
- PMID: 31193043
- PMCID: PMC6514494
- DOI: 10.1016/j.heliyon.2019.e01602
Computer analysis of the sensory qualities of red wines as a method to optimize their blend formulation
Abstract
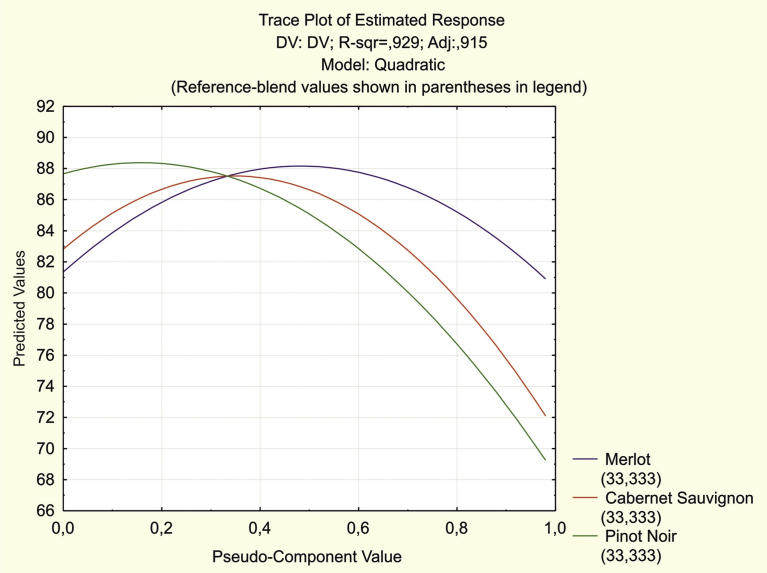
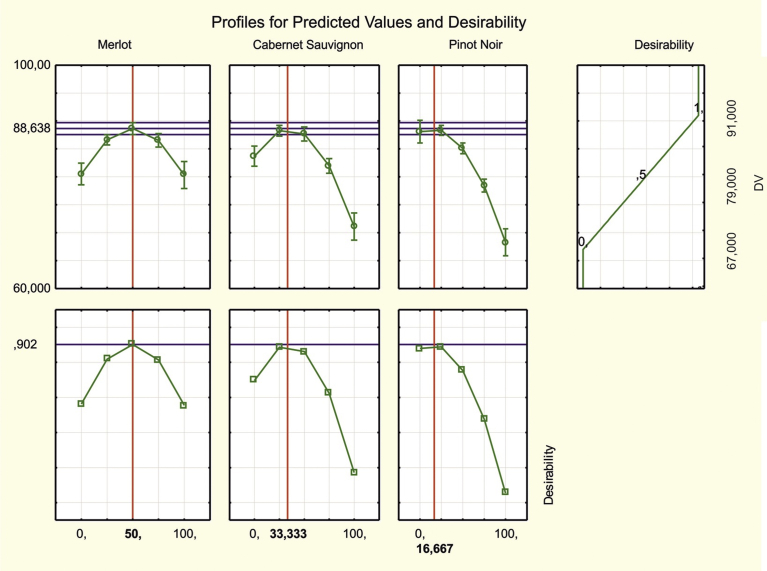
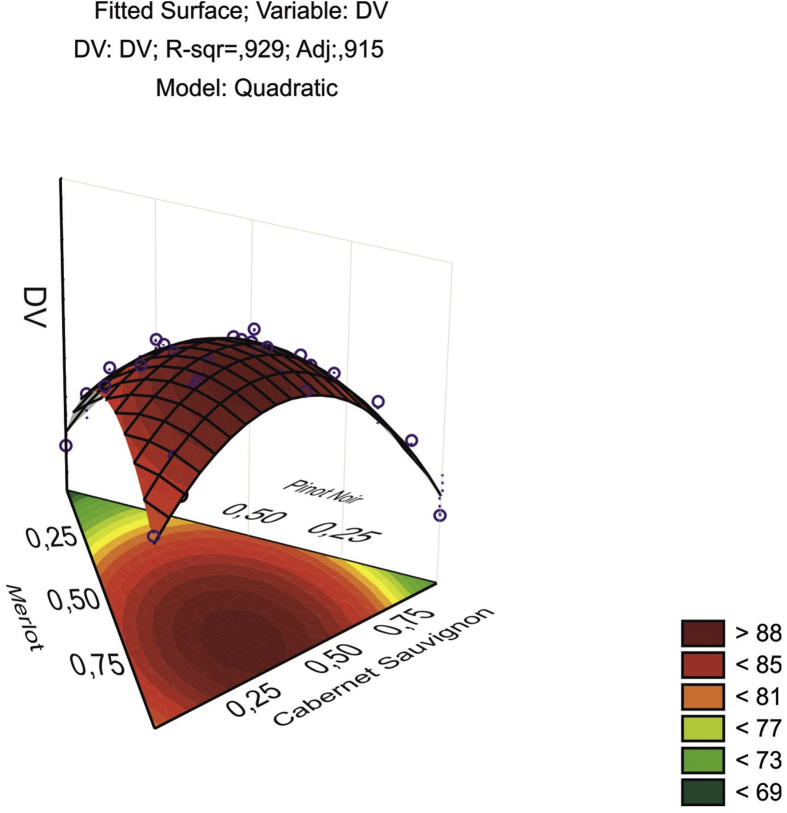
Three high quality red wines - Merlot, Cabernet Sauvignon and Pinot Noir - were used for development of an optimized formulation of a new blended wine called Zvezda Kubani ("The Star of Kuban"). The experimental plan was implemented with the mixture designs and triangular surfaces module in the STATISTICA package. According to the experimental plan, we made and studied 31 variants of wines, including 3 monovariants, 3 mixtures of 2 wines and 25 mixtures of 3 wines. In addition, highly qualified specialists have studied the changes in the mixtures according to the results of a sensory assessment to model the connection between the sensory perception of wine mixtures and the new blended wine formulation. As a result, we developed a mathematically proved formulation of a new blended wine, Zvezda Kubani, containing 48% Merlot, 35% Cabernet Sauvignon and 17% Pinot Noir. The experimental verification of the suggested composition of the blend proved to be a strong indicator of the experts' sensory assessment.
Keywords: Analytical chemistry; Food analysis; Food safety; Food science; Food technology.
Figures


Similar articles
-
Comparative assessment of amino acids and volatile compounds role in the formation of wines sensor properties by means of covariation analysis.Heliyon. 2019 Oct 11;5(10):e02626. doi: 10.1016/j.heliyon.2019.e02626. eCollection 2019 Oct. Heliyon. 2019. PMID: 31667427 Free PMC article.
-
Red Wine Dryness Perception Related to Physicochemistry.J Agric Food Chem. 2020 Mar 11;68(10):2964-2972. doi: 10.1021/acs.jafc.9b01480. Epub 2019 May 2. J Agric Food Chem. 2020. PMID: 30983339
-
Differentiation of the aromas of Merlot and Cabernet Sauvignon wines using sensory and instrumental analysis.J Agric Food Chem. 2000 Nov;48(11):5383-8. doi: 10.1021/jf000401y. J Agric Food Chem. 2000. PMID: 11087489
-
Investigation and Sensory Characterization of 1,4-Cineole: A Potential Aromatic Marker of Australian Cabernet Sauvignon Wine.J Agric Food Chem. 2015 Oct 21;63(41):9103-11. doi: 10.1021/acs.jafc.5b03847. Epub 2015 Oct 8. J Agric Food Chem. 2015. PMID: 26434979
-
Background, Applications and Issues of the Experimental Designs for Mixture in the Food Sector.Foods. 2021 May 19;10(5):1128. doi: 10.3390/foods10051128. Foods. 2021. PMID: 34069527 Free PMC article. Review.
Cited by
-
Use of Multivariate Statistics in the Processing of Data on Wine Volatile Compounds Obtained by HS-SPME-GC-MS.Foods. 2022 Mar 22;11(7):910. doi: 10.3390/foods11070910. Foods. 2022. PMID: 35406997 Free PMC article. Review.
-
Comparative assessment of amino acids and volatile compounds role in the formation of wines sensor properties by means of covariation analysis.Heliyon. 2019 Oct 11;5(10):e02626. doi: 10.1016/j.heliyon.2019.e02626. eCollection 2019 Oct. Heliyon. 2019. PMID: 31667427 Free PMC article.
-
Study of consistency of expert evaluations of wine sensory characteristics by positional analysis.Heliyon. 2021 Feb 2;7(2):e06162. doi: 10.1016/j.heliyon.2021.e06162. eCollection 2021 Feb. Heliyon. 2021. PMID: 33553783 Free PMC article.
-
D-optimal Design Optimization of Solvent Mixture for Flavonoid Extraction from Phalaenopsis Leaves with Antioxidant Activity.J Pharm Bioallied Sci. 2024 Jan-Mar;16(1):1-7. doi: 10.4103/jpbs.jpbs_372_23. Epub 2024 Mar 21. J Pharm Bioallied Sci. 2024. PMID: 38694960 Free PMC article.
-
Optimized Solvents for the Maceration of Phenolic Antioxidants from Curcuma xanthorrhiza Rhizome using a Simplex Centroid Design.J Pharm Bioallied Sci. 2023 Jan-Mar;15(1):35-41. doi: 10.4103/jpbs.jpbs_185_23. Epub 2023 Apr 14. J Pharm Bioallied Sci. 2023. PMID: 37313536 Free PMC article.
References
-
- Wilson D. BIO Web of Conferences. 39th World Congress of Vine and Wine. vol. 7. 2016. Flavoured wine – fad, fashion or trend? p. 5.
-
- Hopfer H., Ebeler S.E., Heymann H. How blending affects the sensory and chemical properties of red wine. Am. J. Enol. Vitic. 2012;63(3):313–324.
-
- Vismara Р., Coletta R., Trombettoni G. Constrained global optimization for wine blending. Constraints. 2016;21(4):597–615.
-
- Koak J.H., Kang B.S., Hahm Y.T., Park C.S., Baik M.Y., Kim B.Y. Blending of different domestic grape wines using mixture design and optimization technique. Food Sci. Biotechnol. 2010;19(4):1011–1018.
-
- Dooley L., Threlfall R.T., Meulleneta J.-F. Optimization of blended wine quality through maximization of consumer liking. Food Qual. Prefer. 2012;24(1):40–47.
LinkOut - more resources
Full Text Sources
Research Materials
