

Development of a mouse iron overload-induced liver injury model and evaluation of the beneficial effects of placenta extract on iron metabolism
- PMID: 31193082
- PMCID: PMC6515419
- DOI: 10.1016/j.heliyon.2019.e01637
Development of a mouse iron overload-induced liver injury model and evaluation of the beneficial effects of placenta extract on iron metabolism
Abstract
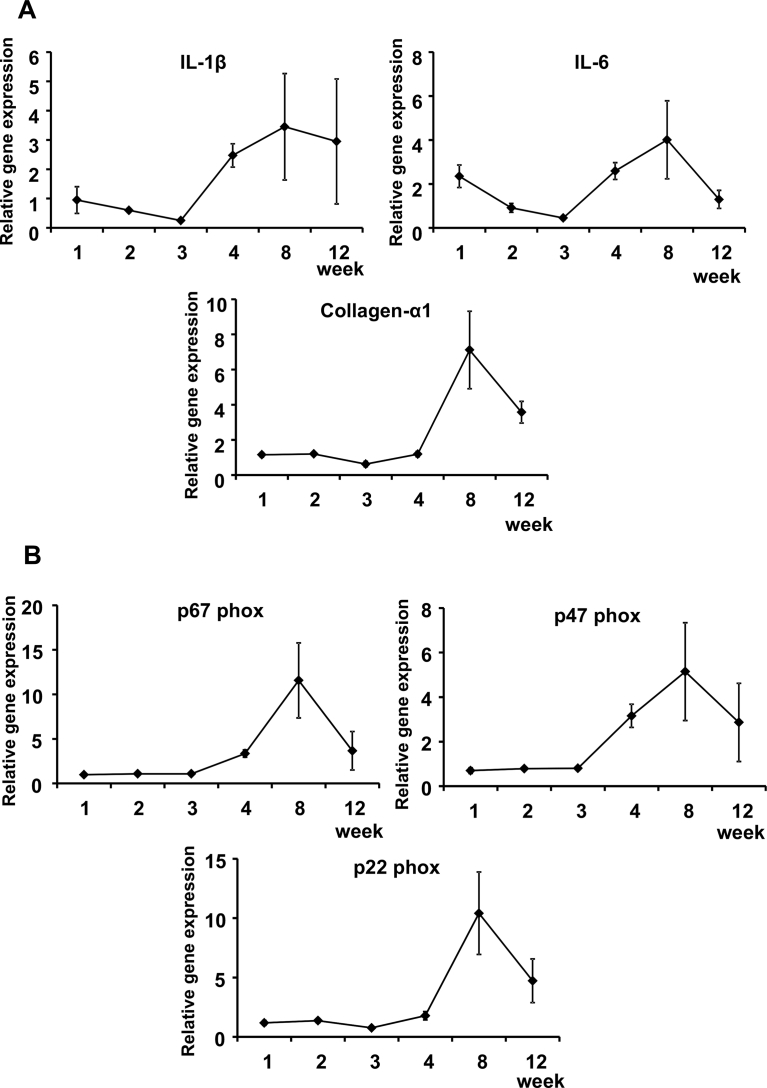
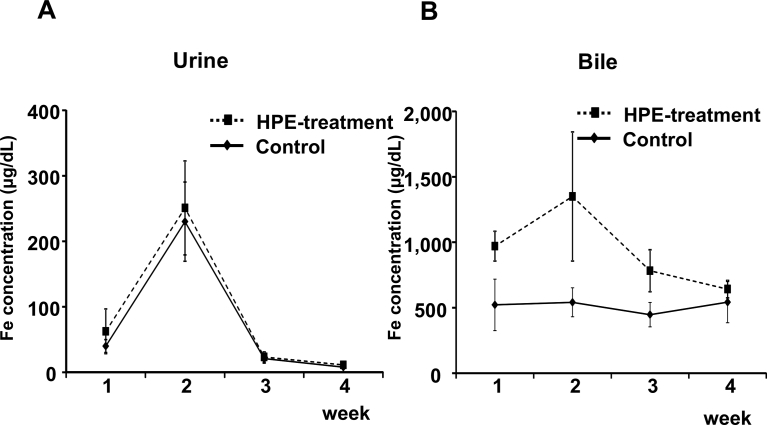
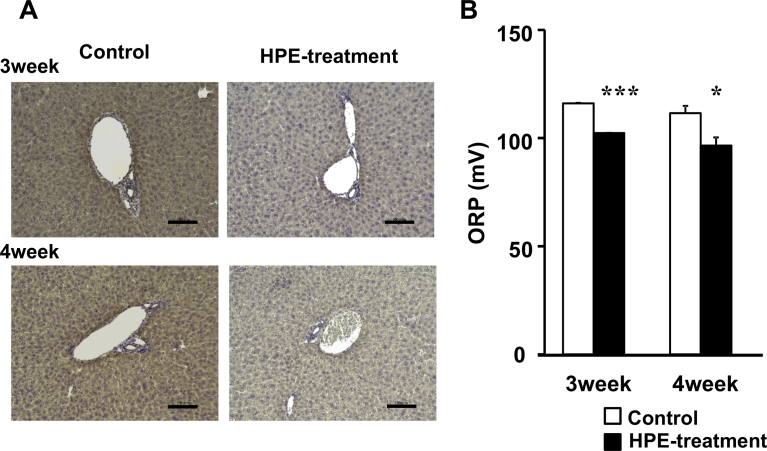
Hepatic iron deposition is seen in cases of chronic hepatitis and cirrhosis, and is a hallmark of a poorer prognosis. Iron deposition is also found in non-alcoholic steatohepatitis (NASH) patients. We have now developed a mouse model of NASH with hepatic iron deposition by combining a methione- and choline-deficient (MCD) diet with an iron-overload diet. Using this model, we evaluated the effects of human placenta extract (HPE), which has been shown to ameliorate the pathology of NASH. Four-week-old male C57BL/6 mice were fed the MCD diet with 2% iron for 12 weeks. In liver sections, iron deposition was first detected around the portal vein after 1 week. From there it spread throughout the parenchyma. Biliary iron concentrations were continuously elevated throughout the entire 12-week diet. As a compensatory response, the diet caused elevation of serum hepcidin, which accelerates excretion of iron from the body. Accumulation of F4/80-positive macrophages was detected within the sinusoids from the first week onward, and real-time PCR analysis revealed elevated hepatic expression of genes related inflammation and oxidative stress. In the model mice, HPE treatment led to a marked reduction of hepatic iron deposition with a corresponding increase in biliary iron excretion. Macrophage accumulation was much reduced by HPE treatment, as was the serum oxidation-reduction potential, an index of oxidative stress. These data indicate that by suppressing inflammation, oxidative stress and iron deposition, and enhancing iron excretion, HPE effectively ameliorates iron overload-induced liver injury. HPE administration may thus be an effective strategy for treating NASH.
Keywords: Molecular biology.
Figures


Similar articles
-
Placental extract ameliorates non-alcoholic steatohepatitis (NASH) by exerting protective effects on endothelial cells.Heliyon. 2017 Sep 27;3(9):e00416. doi: 10.1016/j.heliyon.2017.e00416. eCollection 2017 Sep. Heliyon. 2017. PMID: 29022011 Free PMC article.
-
Strain- and time-dependent alterations in hepatic iron metabolism in a murine model of nonalcoholic steatohepatitis.Cell Biochem Funct. 2016 Dec;34(8):628-639. doi: 10.1002/cbf.3238. Cell Biochem Funct. 2016. PMID: 27935134
-
Elevated free cholesterol in a p62 overexpression model of non-alcoholic steatohepatitis.World J Gastroenterol. 2014 Dec 21;20(47):17839-50. doi: 10.3748/wjg.v20.i47.17839. World J Gastroenterol. 2014. PMID: 25548482 Free PMC article.
-
Effects of treatment with hydrogen sulfide on methionine-choline deficient diet-induced non-alcoholic steatohepatitis in rats.J Gastroenterol Hepatol. 2014 Jan;29(1):215-22. doi: 10.1111/jgh.12389. J Gastroenterol Hepatol. 2014. PMID: 24117897
-
[The role of iron overload in the progression of nonalcoholic steatohepatitis (NASH)].Nihon Yakurigaku Zasshi. 2019;154(2):61-65. doi: 10.1254/fpj.154.61. Nihon Yakurigaku Zasshi. 2019. PMID: 31406044 Review. Japanese.
Cited by
-
Protective Effect and Mechanism of Placenta Extract on Liver.Nutrients. 2022 Nov 29;14(23):5071. doi: 10.3390/nu14235071. Nutrients. 2022. PMID: 36501102 Free PMC article. Review.
-
Hepcidin and Erythroferrone Correlate with Hepatic Iron Transporters in Rats Supplemented with Multispecies Probiotics.Molecules. 2020 Apr 5;25(7):1674. doi: 10.3390/molecules25071674. Molecules. 2020. PMID: 32260496 Free PMC article.
-
Diagnostic value of T2 relaxation time for hepatic iron grading in rat model of fatty and fibrotic liver.PLoS One. 2022 Dec 5;17(12):e0278574. doi: 10.1371/journal.pone.0278574. eCollection 2022. PLoS One. 2022. PMID: 36469532 Free PMC article.
References
-
- Crichton R.R., Wilmet S., Legssyer R., Ward R.J. Molecular and cellular mechanisms of iron homeostasis and toxicity in mammalian cells. J. Inorg. Biochem. 2002;91(1):9–18. Epub 2002/07/18. PubMed PMID: 12121757. - PubMed
-
- Galaris D., Pantopoulos K. Oxidative stress and iron homeostasis: mechanistic and health aspects. Crit. Rev. Clin. Lab. Sci. 2008;45(1):1–23. Epub 2008/02/23. PubMed PMID: 18293179. - PubMed
-
- Lin T.J., Liao L.Y., Lin C.L., Chang T.A., Liu S.O. Hepatic iron influences responses to combination therapy with peginterferon alfa and ribavirin in chronic hepatitis C. Hepato-Gastroenterology. 2008;55(85):1412–1415. Epub 2008/09/18. PubMed PMID: 18795701. - PubMed
-
- Byron D., Minuk G.Y. Clinical hepatology: profile of an urban, hospital-based practice. Hepatology. 1996;24(4):813–815. Epub 1996/10/01. PubMed PMID: 8855181. - PubMed
-
- Marchesini G., Brizi M., Morselli-Labate A.M., Bianchi G., Bugianesi E., McCullough A.J. Association of nonalcoholic fatty liver disease with insulin resistance. Am. J. Med. 1999;107(5):450–455. Epub 1999/11/24. PubMed PMID: 10569299. - PubMed
LinkOut - more resources
Full Text Sources
Research Materials
