

Increased FoxO3a expression prevents osteoblast differentiation and matrix calcification
- PMID: 31193232
- PMCID: PMC6522754
- DOI: 10.1016/j.bonr.2019.100206
Increased FoxO3a expression prevents osteoblast differentiation and matrix calcification
Erratum in
-
Erratum regarding missing Declaration of Competing Interest statements in previously published articles.Bone Rep. 2021 Apr 30;14:101086. doi: 10.1016/j.bonr.2021.101086. eCollection 2021 Jun. Bone Rep. 2021. PMID: 34150957 Free PMC article.
Abstract
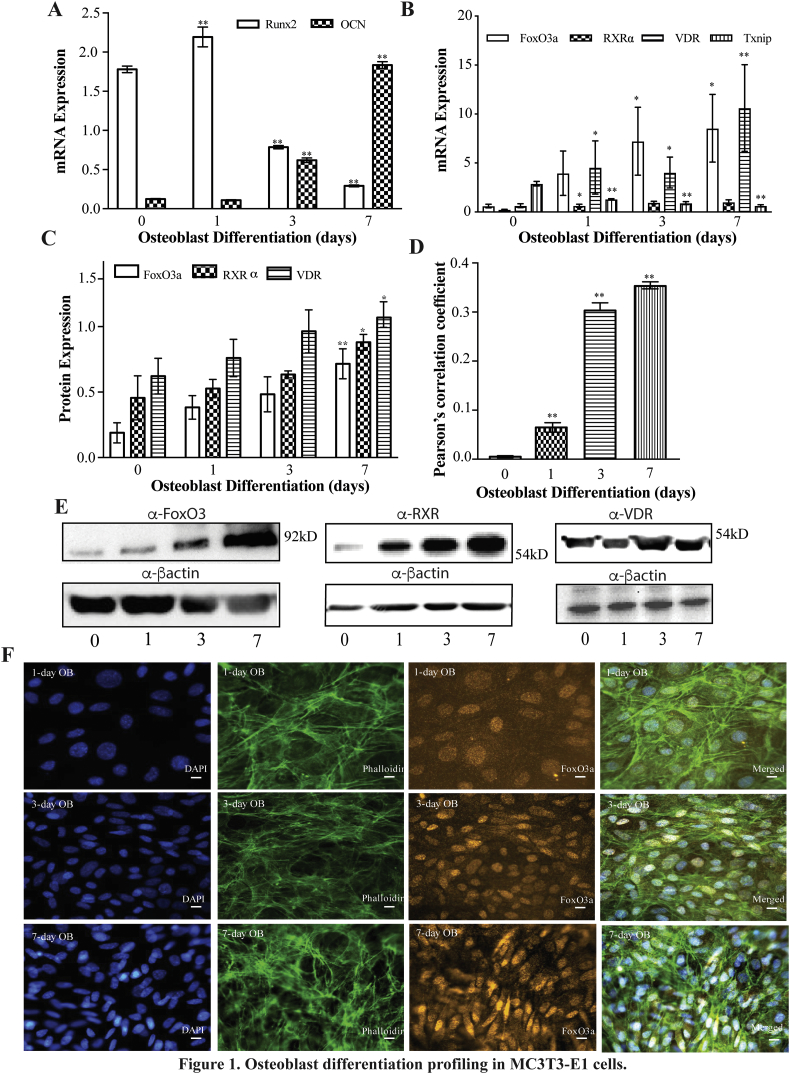
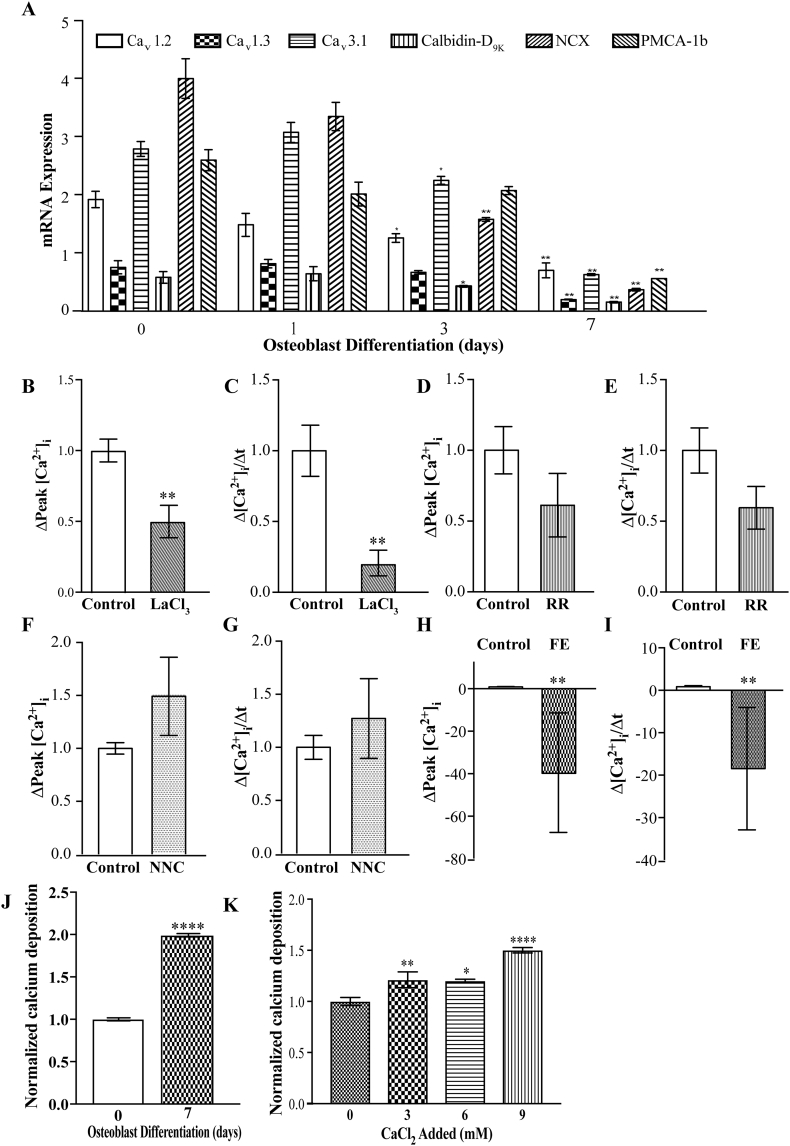
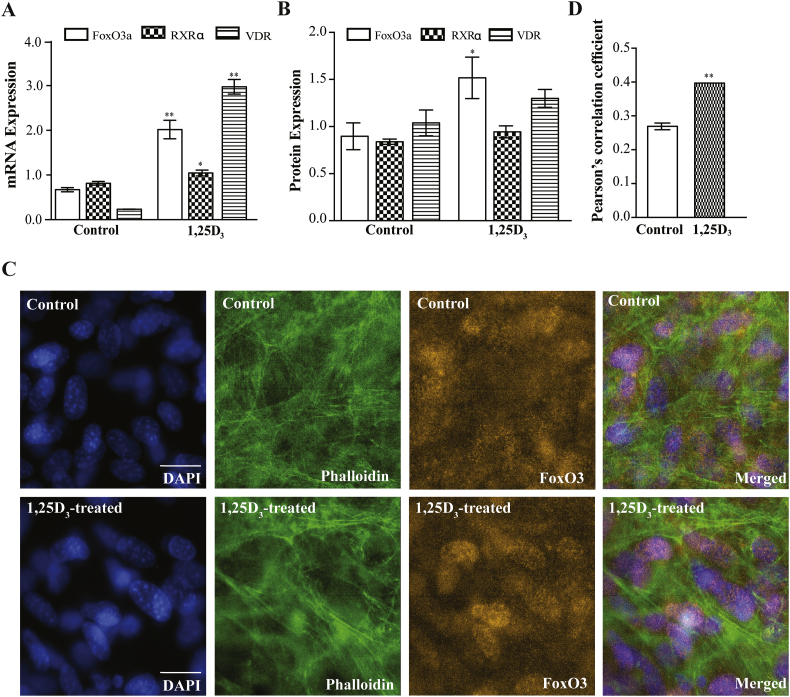
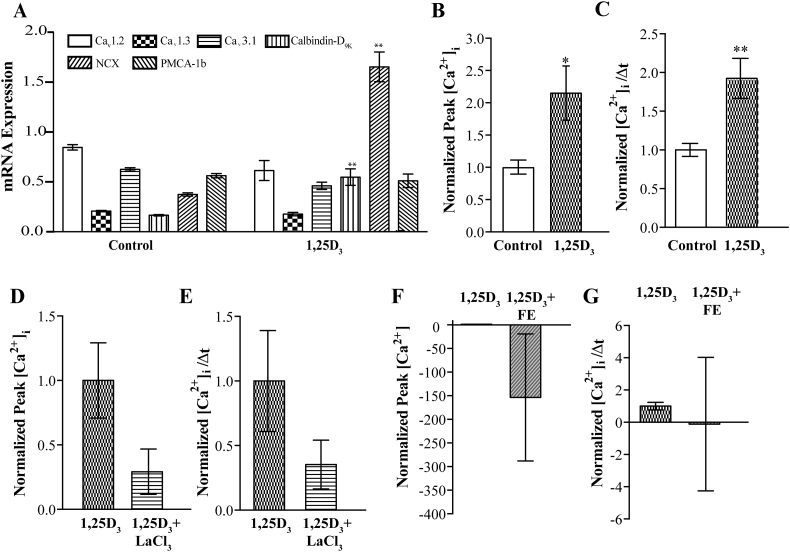
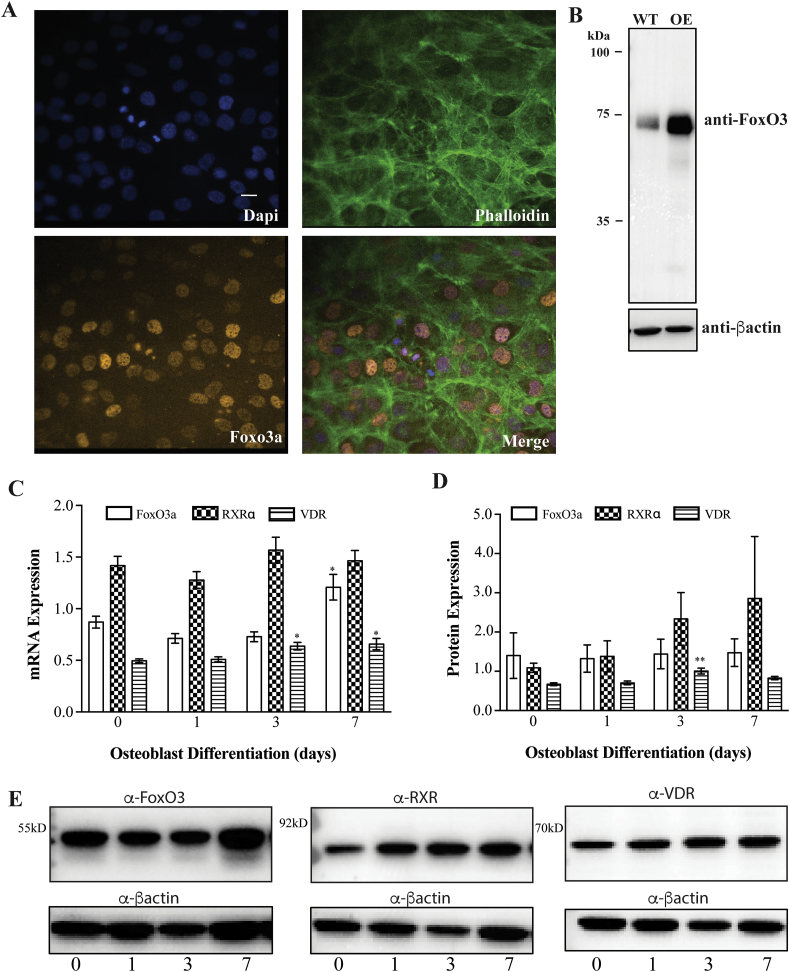
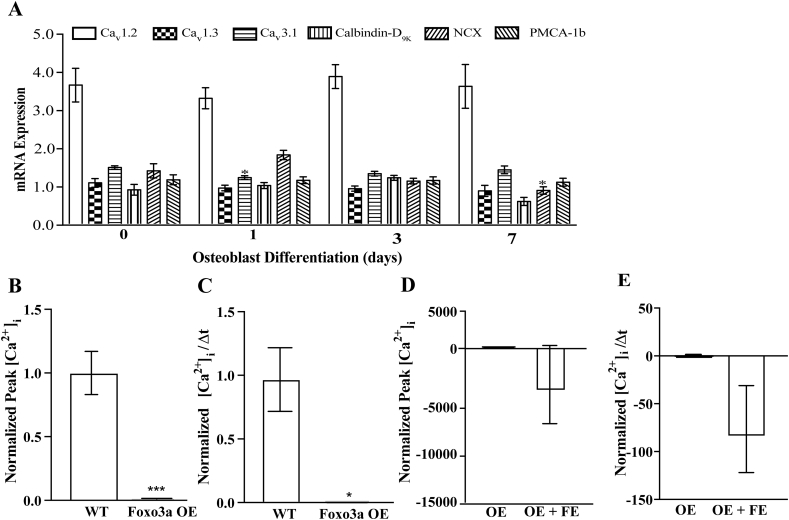
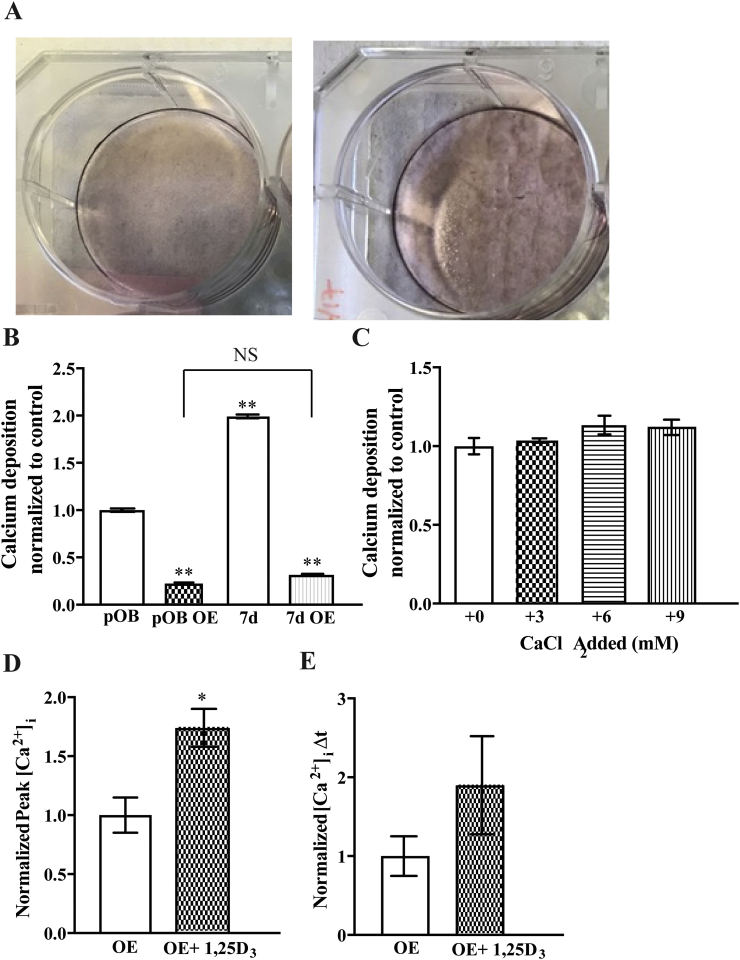
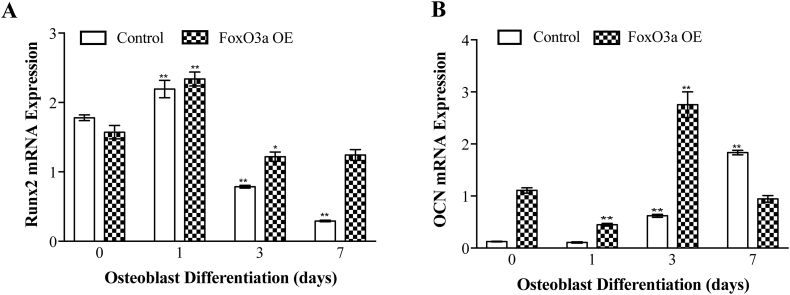
Forkhead Box O transcription factors play important roles in bone metabolism by defending against oxidative stress and apoptosis. FoxO3a is of special interest as it is the predominant isoform expressed in bone. In osteoblasts, the administration of 1,25 dihydroxyvitamin D3 (1,25D3) increases FoxO3a expression, and alters calcium handling. We therefore queried whether FoxO3a participates in vitamin D-mediated regulation of calcium transport pathways or matrix calcification, independent of reactive oxygen species (ROS) formation. To examine this possibility, we differentiated MC3T3-E1 cells into mature osteoblast-like cells over 7 days. This coincided with an increased ability to mineralize extracellular matrix. FoxO3a expression increased throughout differentiation. 1,25D3 enhanced both FoxO3a mRNA and protein expression. Immunofluorescence microscopy found increased FoxO3a nuclear localization with differentiation and after treatment with 1,25D3. Live cell ratiometric imaging with Fura-2AM identified significant L-type calcium channel mediated calcium uptake that was enhanced by 1,25D3. We observed expression of both Cav1.2 and Cav1.3, although expression decreased throughout differentiation and was not altered by 1,25D3 treatment. FoxO3a overexpression reduced calcium uptake and calcium deposition. FoxO3a overexpression also prevented alterations in calcium channel expression and the cell differentiation associated decrease in expression of Runx2 and increased expression of osteocalcin, findings consistent with a failure for the cells to differentiate. Based on both our expression and functional data, we suggest that high levels of FoxO3a prevent osteoblast differentiation and matrix calcification.
Keywords: Calcium deposition; Forkhead Box O3; MC3T3-E1 cells; Matrix calcification; Osteoblast differentiation; Osteoblast mineralization.
Figures
Similar articles
-
1Alpha,25-(OH)2D3 acts in the early phase of osteoblast differentiation to enhance mineralization via accelerated production of mature matrix vesicles.J Cell Physiol. 2010 Nov;225(2):593-600. doi: 10.1002/jcp.22244. J Cell Physiol. 2010. PMID: 20506116
-
Evidence of vitamin D and interferon-β cross-talk in human osteoblasts with 1α,25-dihydroxyvitamin D3 being dominant over interferon-β in stimulating mineralization.J Cell Physiol. 2012 Sep;227(9):3258-66. doi: 10.1002/jcp.24020. J Cell Physiol. 2012. PMID: 22105341
-
Triiodothyronine (T3) and 1,25-dihydroxyvitamin D3 (1,25D3) inversely regulate OPG gene expression in dependence of the osteoblastic phenotype.Calcif Tissue Int. 2004 Apr;74(4):382-7. doi: 10.1007/s00223-003-0033-5. Calcif Tissue Int. 2004. PMID: 15255076
-
Vitamin D and gene networks in human osteoblasts.Front Physiol. 2014 Apr 9;5:137. doi: 10.3389/fphys.2014.00137. eCollection 2014. Front Physiol. 2014. PMID: 24782782 Free PMC article. Review.
-
Cell-type-dependent up-regulation of in vitro mineralization after overexpression of the osteoblast-specific transcription factor Runx2/Cbfal.J Bone Miner Res. 2002 Nov;17(11):1931-44. doi: 10.1359/jbmr.2002.17.11.1931. J Bone Miner Res. 2002. PMID: 12412799
Cited by
-
The Roles of Forkhead Box O3a (FOXO3a) in Bone and Cartilage Diseases - A Narrative Review.Drug Des Devel Ther. 2025 Feb 27;19:1357-1375. doi: 10.2147/DDDT.S494841. eCollection 2025. Drug Des Devel Ther. 2025. PMID: 40034405 Free PMC article. Review.
-
Nanoscale perfluorocarbon expediates bone fracture healing through selectively activating osteoblastic differentiation and functions.J Nanobiotechnology. 2020 Jun 3;18(1):84. doi: 10.1186/s12951-020-00641-2. J Nanobiotechnology. 2020. PMID: 32493334 Free PMC article.
-
Up-regulation of SIRT1 induced by 17beta-estradiol promotes autophagy and inhibits apoptosis in osteoblasts.Aging (Albany NY). 2021 Oct 28;13(20):23652-23671. doi: 10.18632/aging.203639. Epub 2021 Oct 28. Aging (Albany NY). 2021. PMID: 34711685 Free PMC article.
-
FOXO3a Alleviates the Inflammation and Oxidative Stress via Regulating TGF-β and HO-1 in Ankylosing Spondylitis.Front Immunol. 2022 Jun 17;13:935534. doi: 10.3389/fimmu.2022.935534. eCollection 2022. Front Immunol. 2022. PMID: 35784335 Free PMC article.
-
Human Osteoblast Migration in DC Electrical Fields Depends on Store Operated Ca2+-Release and Is Correlated to Upregulation of Stretch-Activated TRPM7 Channels.Front Bioeng Biotechnol. 2019 Dec 12;7:422. doi: 10.3389/fbioe.2019.00422. eCollection 2019. Front Bioeng Biotechnol. 2019. PMID: 31921825 Free PMC article.
References
-
- Ambrogini E., Almeida M., Martin-Millan M., Paik J.K., Depinho R.A., Han L., Goellner J., Weinstein R.S., Jilka R.L., O'Brien C.A., Manolagas S.C. FoxO-mediated defense against oxidative stress in osteoblasts is indispensable for skeletal homeostasis in mice. Cell Metab. 2010;11(2):136–146. - PMC - PubMed
-
- Anderson H.C. Molecular biology of matrix vesicles. Clin. Orthop. Relat. Res. 1995;(314):266–280. - PubMed
-
- Bartell S.M., Kim H.N., Ambrogini E., Han L., Iyer S., Serra Ucer S., Rabinovitch P., Jilka R.L., Weinstein R.S., Zhao H., O'Brien C.A., Manolagas S.C., Almeida M. FoxO proteins restrain osteoclastogenesis and bone resorption by attenuating H2O2 accumulation. Nat. Commun. 2014;5:3773. - PMC - PubMed
-
- Calnan D.R., Brunet A. The FoxO code. Oncogene. 2008;27(16):2276–2288. - PubMed
LinkOut - more resources
Full Text Sources
Research Materials
