

Automation of fizzy extraction enabled by inexpensive open-source modules
- PMID: 31193233
- PMCID: PMC6522666
- DOI: 10.1016/j.heliyon.2019.e01639
Automation of fizzy extraction enabled by inexpensive open-source modules
Abstract
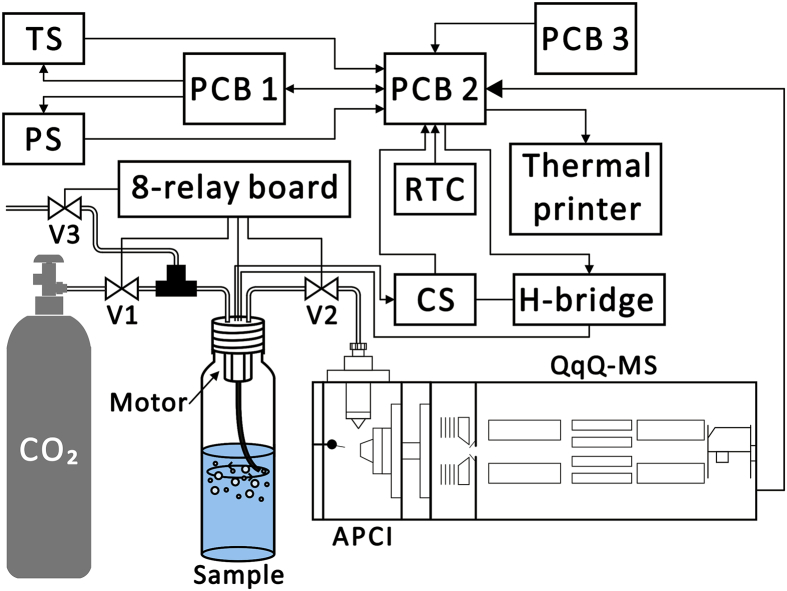
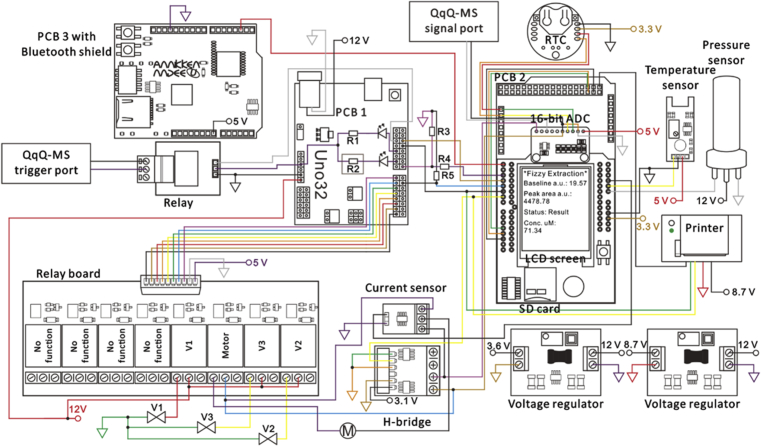
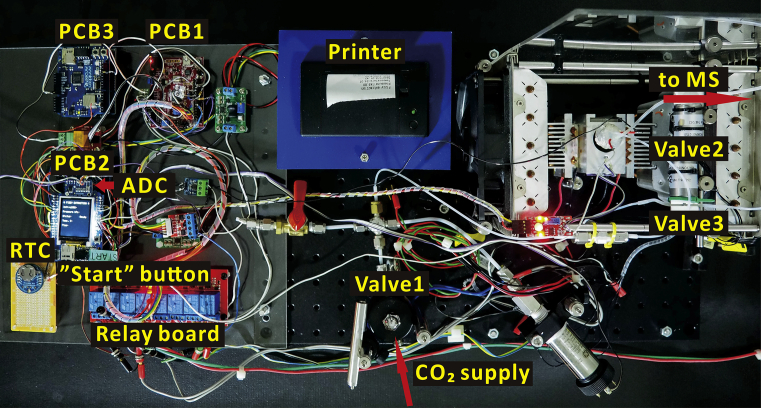
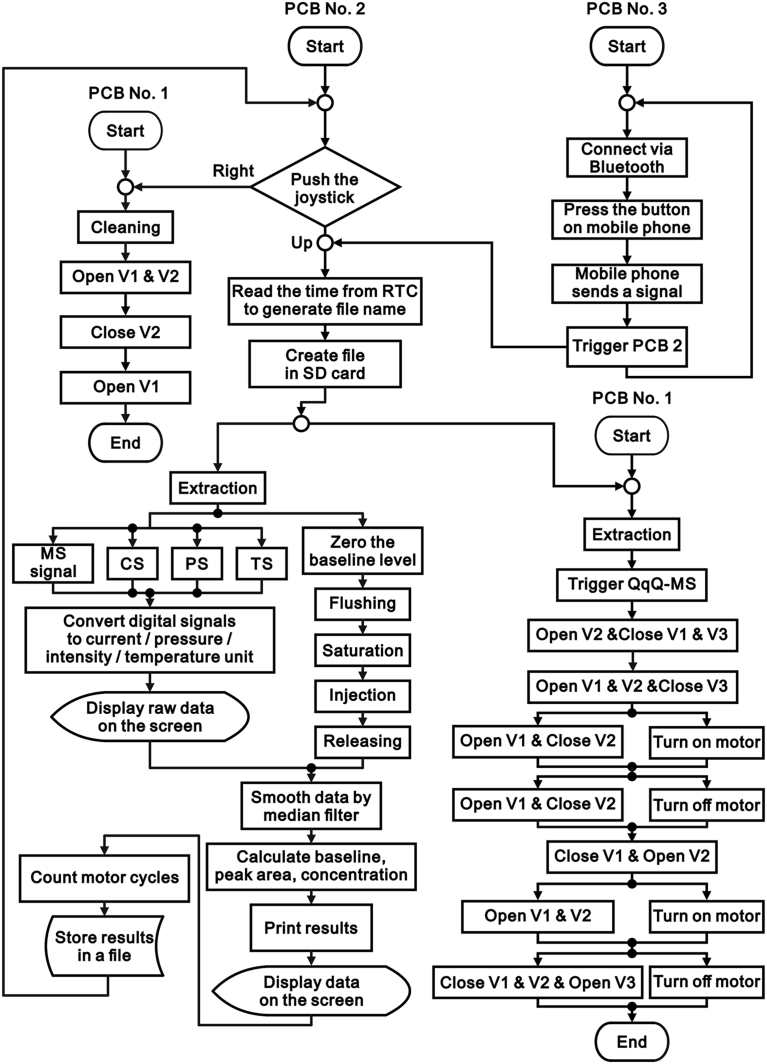
The implementation of most instrumental analysis methods requires a considerable amount of human effort at every step, including sample preparation, detection, and data processing. Automated analytical workflows decrease the amount of required work. However, commercial automated platforms are mainly available for well-established sample processing methods. In contrast, newly developed prototypes of analytical instruments are often operated manually, what limits their performance and decreases the chance of their adoption by the broader community. Open-source electronic modules facilitate the prototyping of complex analytical instruments and enable the incorporation of automated functions at the early stage of technique development. Here, we exemplify this advantage of open-source electronics while prototyping an automated analytical device. Fizzy extraction takes advantage of the effervescence phenomenon to extract semi-volatile solutes from the liquid to the gas phase. The entire fizzy extraction process has been automated by using three Arduino-related microcontrollers. The functions of the developed autonomous fizzy extraction device include triggering the analysis by a smartphone app, control of carrier gas pressure in the headspace of the sample chamber, displaying experimental conditions on an LCD screen, acquiring mass spectrometry data in real time, filtering electronic noise, integrating peaks, calculating the analyte concentration in the extracted sample, printing the analysis report, storing the acquired data in non-volatile memory, monitoring the condition of the motor by counting the number of extraction cycles, and cleaning the elements exposed to the sample (to minimize carryover). The performance of this automated system has been evaluated using standards and real samples.
Keywords: Analytical chemistry.
Figures
Similar articles
-
Fizzy Extraction of Volatile Organic Compounds Combined with Atmospheric Pressure Chemical Ionization Quadrupole Mass Spectrometry.J Vis Exp. 2017 Jul 14;(125):56008. doi: 10.3791/56008. J Vis Exp. 2017. PMID: 28745648 Free PMC article.
-
Fizzy Extraction of Volatile and Semivolatile Compounds into the Gas Phase.Anal Chem. 2016 Sep 6;88(17):8735-40. doi: 10.1021/acs.analchem.6b02074. Epub 2016 Aug 18. Anal Chem. 2016. PMID: 27504910
-
Portable fizzy extraction ion-mobility spectrometry system.Anal Chim Acta. 2022 Apr 29;1204:339699. doi: 10.1016/j.aca.2022.339699. Epub 2022 Mar 15. Anal Chim Acta. 2022. PMID: 35397903
-
Automation of mass spectrometric detection of analytes and related workflows: A review.Talanta. 2020 Feb 1;208:120304. doi: 10.1016/j.talanta.2019.120304. Epub 2019 Aug 29. Talanta. 2020. PMID: 31816721 Review.
-
Preliminary Planning for Mars Sample Return (MSR) Curation Activities in a Sample Receiving Facility (SRF).Astrobiology. 2022 Jun;22(S1):S57-S80. doi: 10.1089/AST.2021.0105. Epub 2022 May 19. Astrobiology. 2022. PMID: 34904890 Review.
Cited by
-
Low-cost and open-source strategies for chemical separations.J Chromatogr A. 2021 Feb 8;1638:461820. doi: 10.1016/j.chroma.2020.461820. Epub 2020 Dec 24. J Chromatogr A. 2021. PMID: 33453654 Free PMC article. Review.
-
Facilitating chemical and biochemical experiments with electronic microcontrollers and single-board computers.Nat Protoc. 2020 Mar;15(3):925-990. doi: 10.1038/s41596-019-0272-1. Epub 2020 Jan 29. Nat Protoc. 2020. PMID: 31996842
References
-
- Kong F., Yuan L., Zheng Y.F., Chen W. Automatic liquid handling for life science: a critical review of the current state of the art. J. Lab. Autom. 2012;17:169–185. - PubMed
-
- Prabhu G.R.D., Urban P.L. The dawn of unmanned analytical laboratories. Trends Anal. Chem. 2017;88:41–52.
-
- Industry 4.0: the Fourth Industrial Revolution – Guide to Industrie 4.0 https://www.i-scoop.eu/industry-4-0/ (accessed on 11st June, 2018)
-
- Urban P.L. Prototyping instruments for the chemical laboratory using inexpensive electronic modules. Angew. Chem. Int. Ed. 2018;57:11074–11077. - PubMed
-
- Urban P.L. Open-source electronics as a technological aid in chemical education. J. Chem. Educ. 2014;91:751–752.
LinkOut - more resources
Full Text Sources
