

Thyroid-associated Orbitopathy: Quantitative Evaluation of the Orbital Fat Volume and Edema Using IDEAL-FSE
- PMID: 31193388
- PMCID: PMC6526225
- DOI: 10.1016/j.ejro.2019.05.003
Thyroid-associated Orbitopathy: Quantitative Evaluation of the Orbital Fat Volume and Edema Using IDEAL-FSE
Abstract
Background and purpose: To compare orbital quantitative data obtained by fast spin-echo iterative decomposition of water and fat with echo asymmetry and least-squares estimation (FSE-IDEAL) in patients with thyroid-associated orbitopathy (TAO) and healthy controls and to investigate the characteristics of these data in TAO patients.
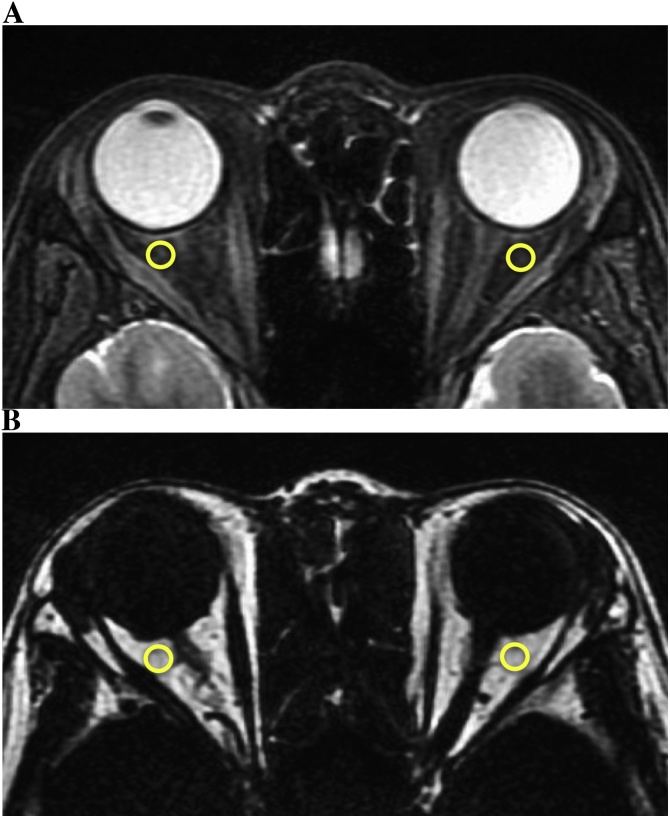
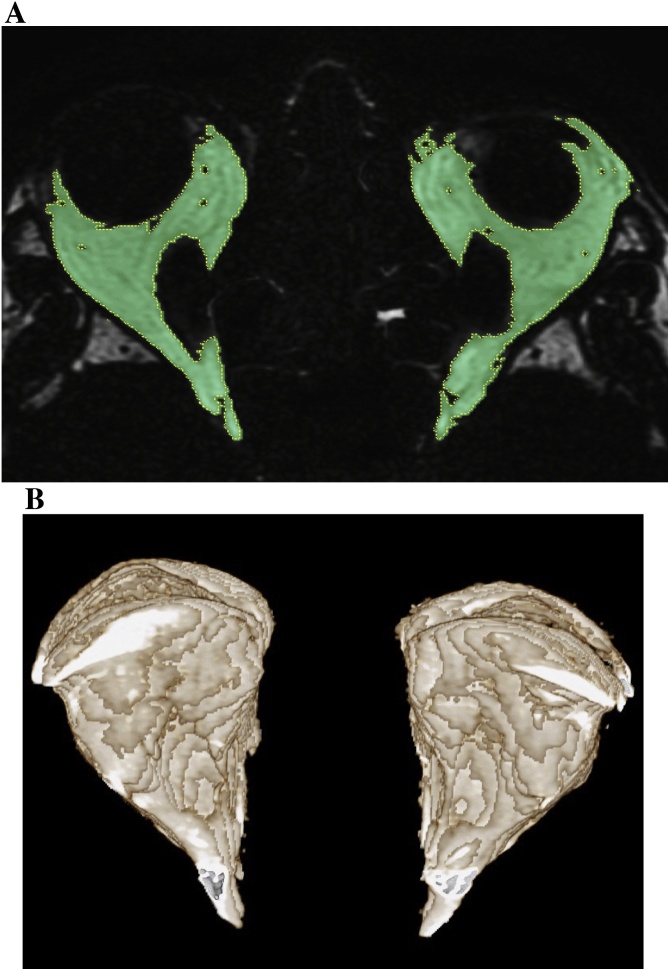
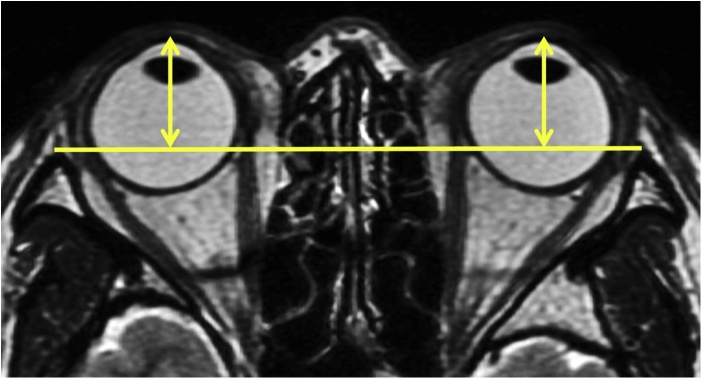
Materials and methods: Twenty-two TAO patients (4 males and 18 females; median age 51.0 years) and 22 healthy subjects (5 males and 17 females; median age 50.5 years) underwent orbital T2-weighted FSE-IDEAL. The water fraction in orbital fat was defined as the signal intensity (SI) water / (SI water + SI fat). The orbital fat volume was measured on fat images. The degree of proptosis was evaluated using in-phase imaging. Mann-Whitney U test was used to compare these quantitative data in the two groups. In TAO patients we ascertained the correlation among these values with the Spearman's rank correlation coefficient.
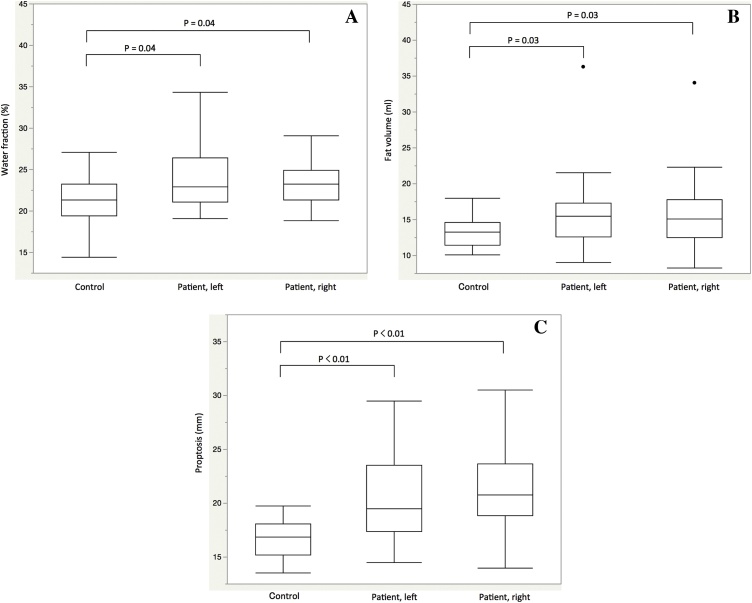
Results: In TAO patients, the water fraction (right and left, p = 0.04), fat volume (right and left, p = 0.03) and degree of proptosis (right and left, p < 0.01) were higher than in the controls. In TAO patients, only the water fraction and the fat volume of left orbit showed negative correlation (p = 0.01).
Conclusion: The water fraction of orbital fat, the orbital fat volume and the degree of proptosis obtained with FSE-IDEAL were higher in TAO patients than in the controls. The water fraction was a new parameter for differentiating between TAO patients and healthy subjects.
Keywords: CAS, clinical activity score; FSE-IDEAL, fast spin-echo iterative decomposition of water and fat with echo asymmetry and least-squares estimation; IQR, interquartile range; SD, standard deviation; SI, signal intensity; TAO, thyroid-associated orbitopathy; fast spin-echo iterative decomposition of water and fat with echo asymmetry and least-squares estimation (FSE-IDEAL); orbital fat volume; proptosis; quantitative evaluation; thyroid-associated orbitopathy (TAO); water fraction.
Figures
Similar articles
-
Orbital Fat Volumetry and Water Fraction Measurements Using T2-Weighted FSE-IDEAL Imaging in Patients with Thyroid-Associated Orbitopathy.AJNR Am J Neuroradiol. 2016 Nov;37(11):2123-2128. doi: 10.3174/ajnr.A4859. Epub 2016 Jun 30. AJNR Am J Neuroradiol. 2016. PMID: 27365323 Free PMC article.
-
Benefits and pitfalls of iterative decomposition of water and fat with echo asymmetry and least-squares estimation (IDEAL) imaging in clinical application of the cervical spine MR.Clin Radiol. 2019 Jan;74(1):78.e13-78.e21. doi: 10.1016/j.crad.2018.09.002. Epub 2018 Oct 9. Clin Radiol. 2019. PMID: 30314808
-
T1- and T2-weighted fast spin-echo imaging of the brachial plexus and cervical spine with IDEAL water-fat separation.J Magn Reson Imaging. 2006 Oct;24(4):825-32. doi: 10.1002/jmri.20721. J Magn Reson Imaging. 2006. PMID: 16969792
-
Simultaneous estimation of tongue volume and fat fraction using IDEAL-FSE.J Magn Reson Imaging. 2008 Aug;28(2):504-8. doi: 10.1002/jmri.21431. J Magn Reson Imaging. 2008. PMID: 18666214 Free PMC article.
-
Quantitative analysis of orbital soft tissues on computed tomography to assess the activity of thyroid-associated orbitopathy.Graefes Arch Clin Exp Ophthalmol. 2017 Feb;255(2):413-420. doi: 10.1007/s00417-016-3538-0. Epub 2016 Nov 12. Graefes Arch Clin Exp Ophthalmol. 2017. PMID: 27838736
Cited by
-
Computed tomography and magnetic resonance imaging approaches to Graves' ophthalmopathy: a narrative review.Front Endocrinol (Lausanne). 2024 Jan 8;14:1277961. doi: 10.3389/fendo.2023.1277961. eCollection 2023. Front Endocrinol (Lausanne). 2024. PMID: 38260158 Free PMC article. Review.
-
Whole-orbit-based multiparametric assessment of disease activity of thyroid eye disease on Dixon MRI.Int Ophthalmol. 2024 May 3;44(1):213. doi: 10.1007/s10792-024-03138-1. Int Ophthalmol. 2024. PMID: 38700596
-
Dixon MRI-based quantitative parameters of extraocular muscles, intraorbital fat, and lacrimal glands for staging thyroid-associated ophthalmopathy.Insights Imaging. 2024 Jun 9;15(1):136. doi: 10.1186/s13244-024-01693-w. Insights Imaging. 2024. PMID: 38853188 Free PMC article.
-
Optic nerve compression associated with visual cortex functional alteration in dysthyroid optic neuropathy: A combined orbital and brain imaging study.CNS Neurosci Ther. 2024 Jul;30(7):e14820. doi: 10.1111/cns.14820. CNS Neurosci Ther. 2024. PMID: 38948947 Free PMC article.
-
Agarose Gel Electrophoresis Reveals the Molecular Weight Distribution of Hyaluronan Produced by Orbital Fibroblasts.Gels. 2025 May 29;11(6):406. doi: 10.3390/gels11060406. Gels. 2025. PMID: 40558705 Free PMC article.
References
-
- Kendler D.L., Lippa J., Rootman J. The initial clinical characteristics of Graves’ orbitopathy vary with age and sex. Arch Ophthalmol. 1993;111:197–201. - PubMed
-
- Kahaly G.J. Imaging in thyroid-associated orbitopathy. Eur J Endocrinol. 2001;145:107–118. - PubMed
-
- Ohnishi T., Noguchi S., Murakami N. Extraocular muscles in Graves ophthalmopathy: Usefulness of T2 relaxation time measurements. Radiology. 1994;190:857–862. - PubMed
-
- Feldon S.E., Lee C.P., Muramatsu S.K. Quantitative computed tomography of Graves’ ophthalmopathy. Extraocular muscle and orbital fat in development of optic neuropathy. Arch Ophthalmol. 1985;103:213–215. - PubMed
LinkOut - more resources
Full Text Sources
