

Voltage-sensitive dye recording of glossopharyngeal nerve-related synaptic networks in the embryonic mouse brainstem
- PMID: 31193501
- PMCID: PMC6531809
- DOI: 10.1016/j.ibror.2019.05.004
Voltage-sensitive dye recording of glossopharyngeal nerve-related synaptic networks in the embryonic mouse brainstem
Abstract
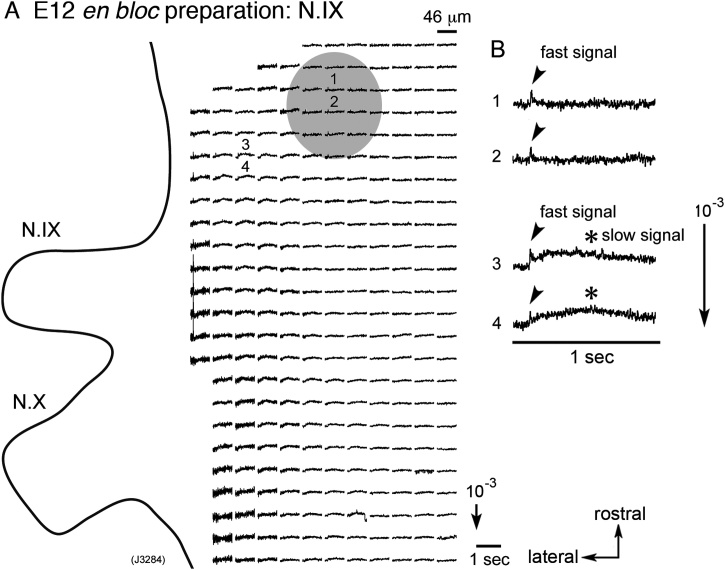
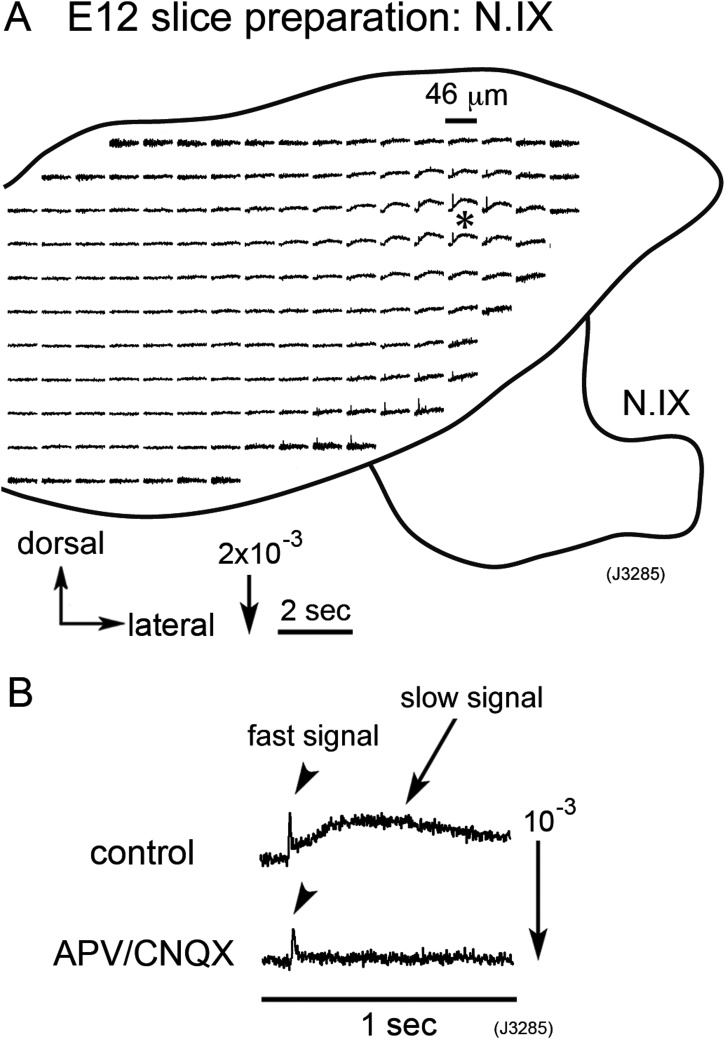
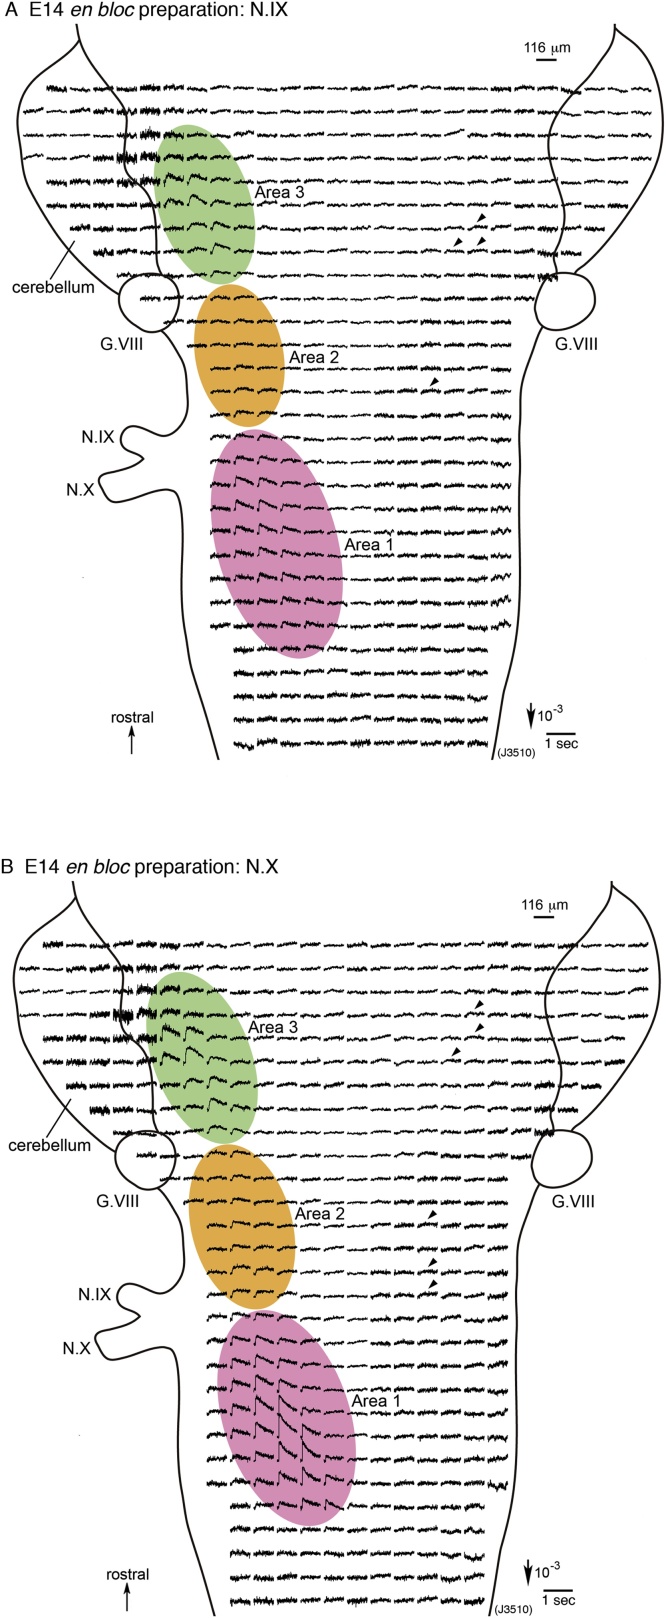
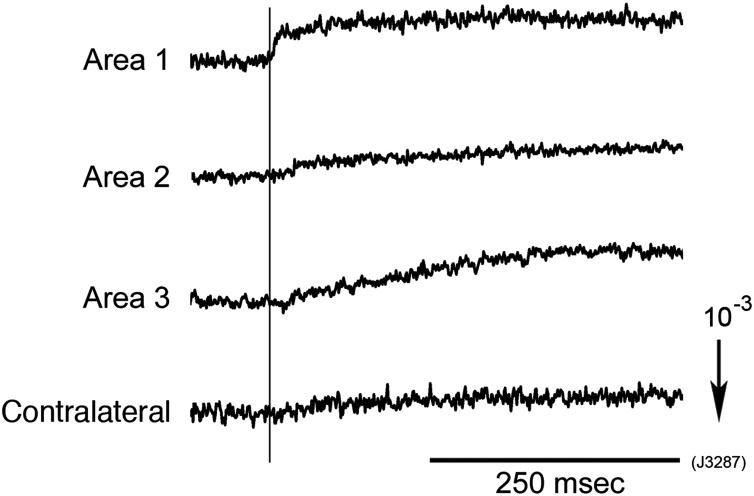
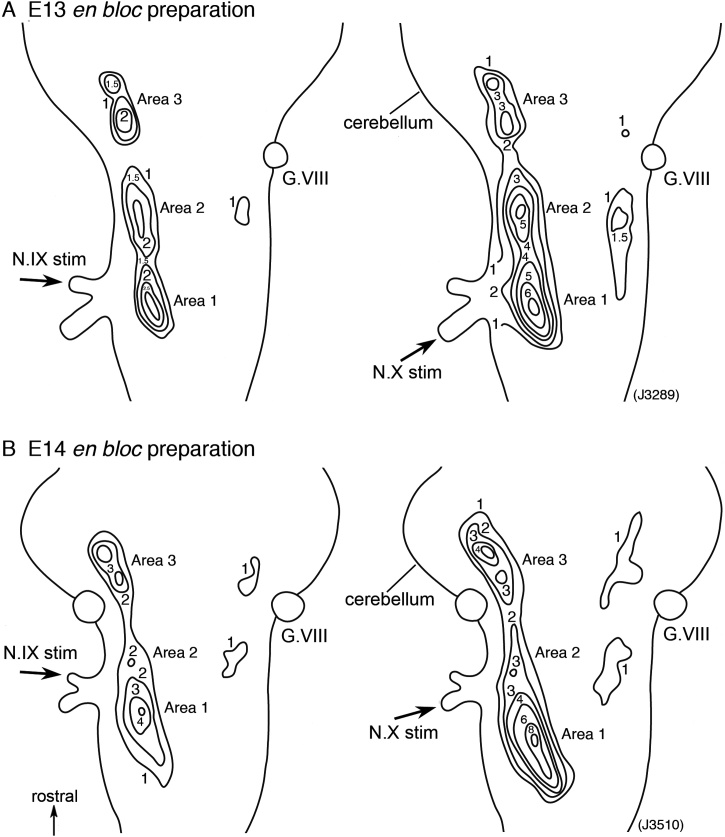
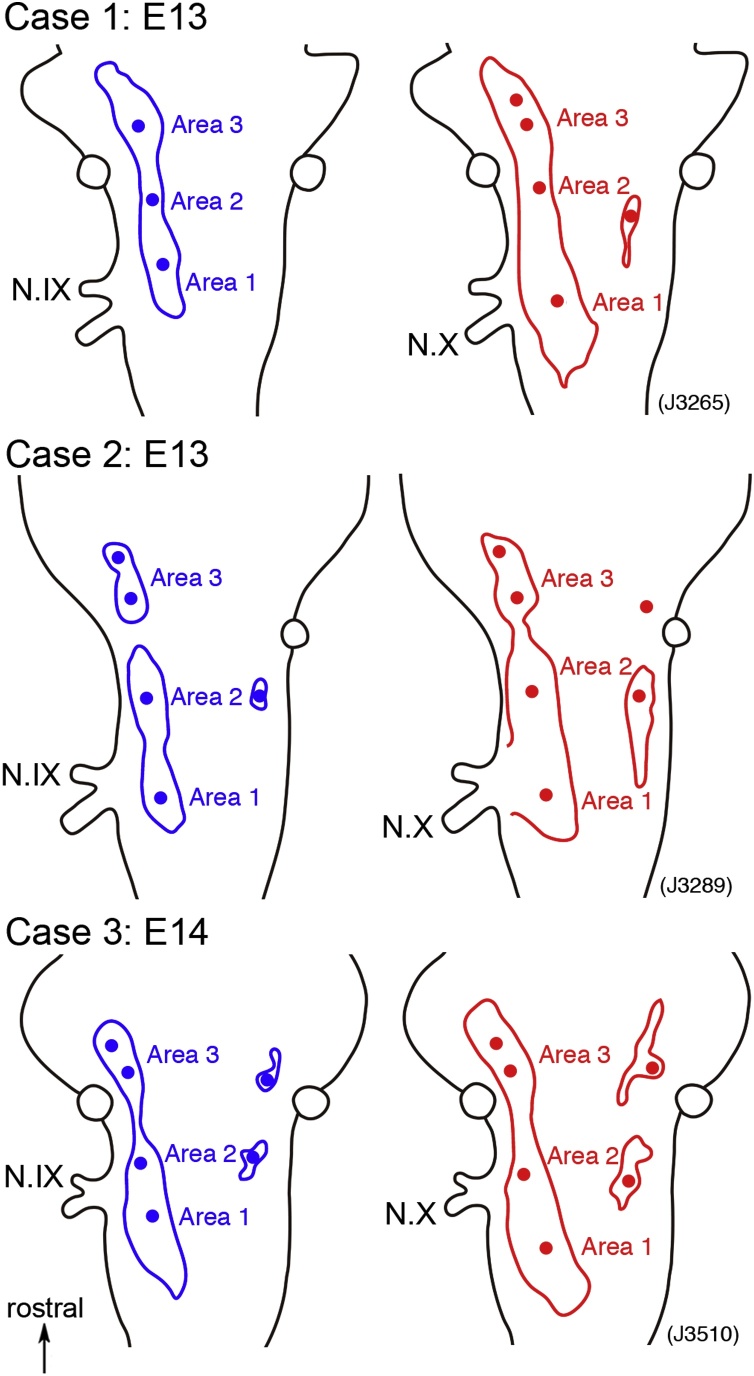
The glossopharyngeal nerve (N.IX) transfers motor and sensory information related to visceral and somatic functions, such as salivary secretion, gustation and the control of blood pressure. N.IX-related neural circuits are indispensable for these essential functions. Compared with the strenuous analysis of morphogenesis, we are only just starting to elucidate the functiogenesis of these neural circuits during ontogenesis. In the present study, we applied voltage-sensitive dye recording to the embryonic mouse brainstem, and examined the functional development of the N.IX-related neural circuits. First, we optically identified the motor nucleus (the inferior salivatory nucleus (ISN)) and the first-order sensory nucleus (the nucleus of the tractus solitarius (NTS)). We also succeeded in recording optical responses in the second/higher-order sensory nuclei via the NTS, including the parabrachial nucleus. Second, we pursued neuronal excitability and the onset of synaptic function in the N.IX-related nuclei. The neurons in the ISN were excitable at least at E11, and functional synaptic transmission in the NTS was first expressed at E12. In the second/higher-order sensory nuclei, synaptic function emerged at around E12-13. Third, by mapping optical responses to N.IX and vagus nerve (N.X) stimulation, we showed that the distribution patterns of neural activity in the NTS were different between the N.IX and the N.X from the early stage of ontogenesis. We discuss N.IX-related neural circuit formation in the brainstem, in comparison with our previous results obtained from chick and rat embryos.
Keywords: APV, dl-2-amino-5-phosphonovaleric acid; CNQX, 6-cyano-7- nitroquinoxaline-2,3-dione; CNS, central nervous system; Development; EPSP, excitatory postsynaptic potential; Glossopharyngeal nerve; ISN, inferior salivatory nucleus; N.IX, glossopharyngeal nerve; N.X, vagus nerve; NTS, nucleus of the tractus solitarius; Neural circuit formation; Optical recording; PBN, parabrachial nucleus; Synaptogenesis; VSD, voltage-sensitive dye; Voltage-sensitive dye.
Figures
Similar articles
-
Functional development of the vagal and glossopharyngeal nerve-related nuclei in the embryonic rat brainstem: optical mapping with a voltage-sensitive dye.Neuroscience. 2011 Sep 29;192:781-92. doi: 10.1016/j.neuroscience.2011.06.019. Epub 2011 Jun 14. Neuroscience. 2011. PMID: 21718760
-
Optical mapping reveals developmental dynamics of Mg2+-/APV-sensitive components of glossopharyngeal glutamatergic EPSPs in the embryonic chick NTS.J Neurophysiol. 2004 Oct;92(4):2538-47. doi: 10.1152/jn.00372.2004. Epub 2004 Jun 2. J Neurophysiol. 2004. PMID: 15175368
-
Development of synaptic networks in the mouse vagal pathway revealed by optical mapping with a voltage-sensitive dye.Eur J Neurosci. 2016 Jul;44(2):1906-18. doi: 10.1111/ejn.13283. Epub 2016 Jun 9. Eur J Neurosci. 2016. PMID: 27207499
-
Optical imaging analysis of neural circuit formation in the embryonic brain.Clin Exp Pharmacol Physiol. 2008 May;35(5-6):706-13. doi: 10.1111/j.1440-1681.2007.04834.x. Epub 2007 Dec 7. Clin Exp Pharmacol Physiol. 2008. PMID: 18067593 Review.
-
The embryonic brain and development of vagal pathways.Respir Physiol Neurobiol. 2011 Aug 31;178(1):163-73. doi: 10.1016/j.resp.2011.01.012. Epub 2011 Feb 3. Respir Physiol Neurobiol. 2011. PMID: 21296688 Review.
Cited by
-
Population imaging discrepancies between a genetically-encoded calcium indicator (GECI) versus a genetically-encoded voltage indicator (GEVI).Sci Rep. 2021 Mar 5;11(1):5295. doi: 10.1038/s41598-021-84651-6. Sci Rep. 2021. PMID: 33674659 Free PMC article.
-
Current Practice in Using Voltage Imaging to Record Fast Neuronal Activity: Successful Examples from Invertebrate to Mammalian Studies.Biosensors (Basel). 2023 Jun 13;13(6):648. doi: 10.3390/bios13060648. Biosensors (Basel). 2023. PMID: 37367013 Free PMC article. Review.
-
Evoked Cortical Depolarizations Before and After the Amyloid Plaque Accumulation: Voltage Imaging Study.J Alzheimers Dis. 2022;88(4):1443-1458. doi: 10.3233/JAD-220249. J Alzheimers Dis. 2022. PMID: 35811528 Free PMC article.
References
-
- Abadie V., Champagnat J., Fortin G. Brachiomotor activities in mouse embryo. Neuroreport. 2000;11:141–145. - PubMed
-
- Altman J., Bayer S.A. Development of the brain stem in the rat. I. Thymidine-radiographic study of the time of origin of neurons of the lower medulla. J. Comp. Neurol. 1980;194:1–35. - PubMed
-
- Altman J., Bayer S.A. Springer-Verlag; Berlin: 1982. Development of the Cranial Nerve Ganglia and Related Nuclei in the Rat. - PubMed
-
- Beckmann M.E., Whitehead M.C. Intramedullary connections of the rostral nucleus of the solitary tract in the hamster. Brain Res. 1991;557:265–279. - PubMed
LinkOut - more resources
Full Text Sources
