

Cancer Incidence and Mortality in Greenland 1983-2014 - Including Comparison With the Other Nordic Countries
- PMID: 31193566
- PMCID: PMC6537509
- DOI: 10.1016/j.eclinm.2018.08.003
Cancer Incidence and Mortality in Greenland 1983-2014 - Including Comparison With the Other Nordic Countries
Abstract
Background: During the last decades, social and life-style changes in Greenland have led to an increase in the incidence of several non-communicable diseases. Our aim is to present the cancer incidence and mortality in Greenland and compare the results with the other Nordic countries.
Methods: The data stems from The Danish Cancer Registry and The Danish Register of Causes of Death. Comparable data on cancer incidence and mortality in Denmark, Finland, Iceland, Norway, Sweden, and Greenland are available through collaboration between Nordic Cancer Registries (NORDCAN). We included all individuals residing in Greenland and diagnosed with or died of a cancer from 1983 to 2014.
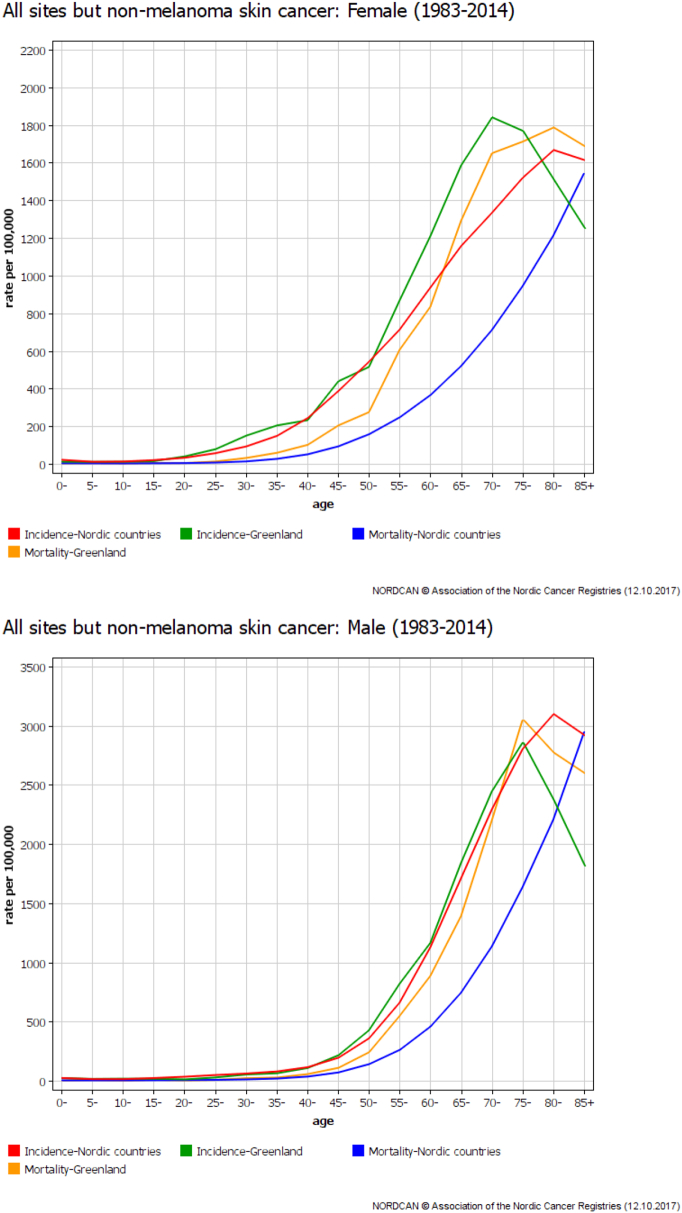
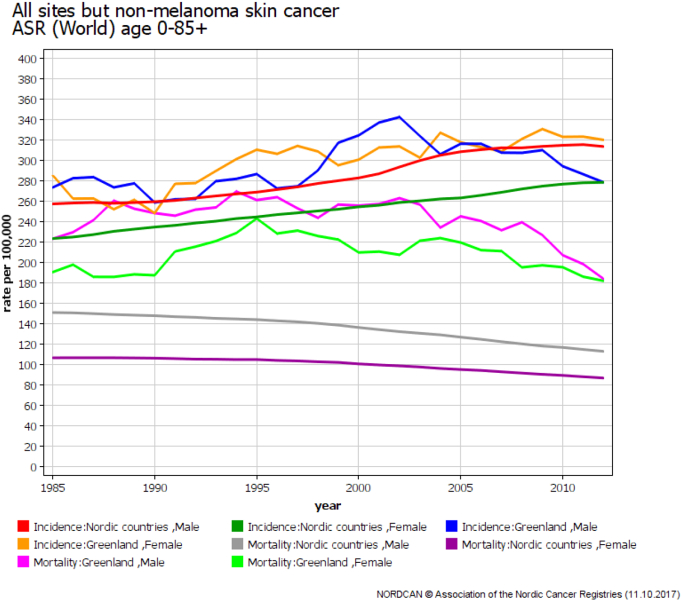
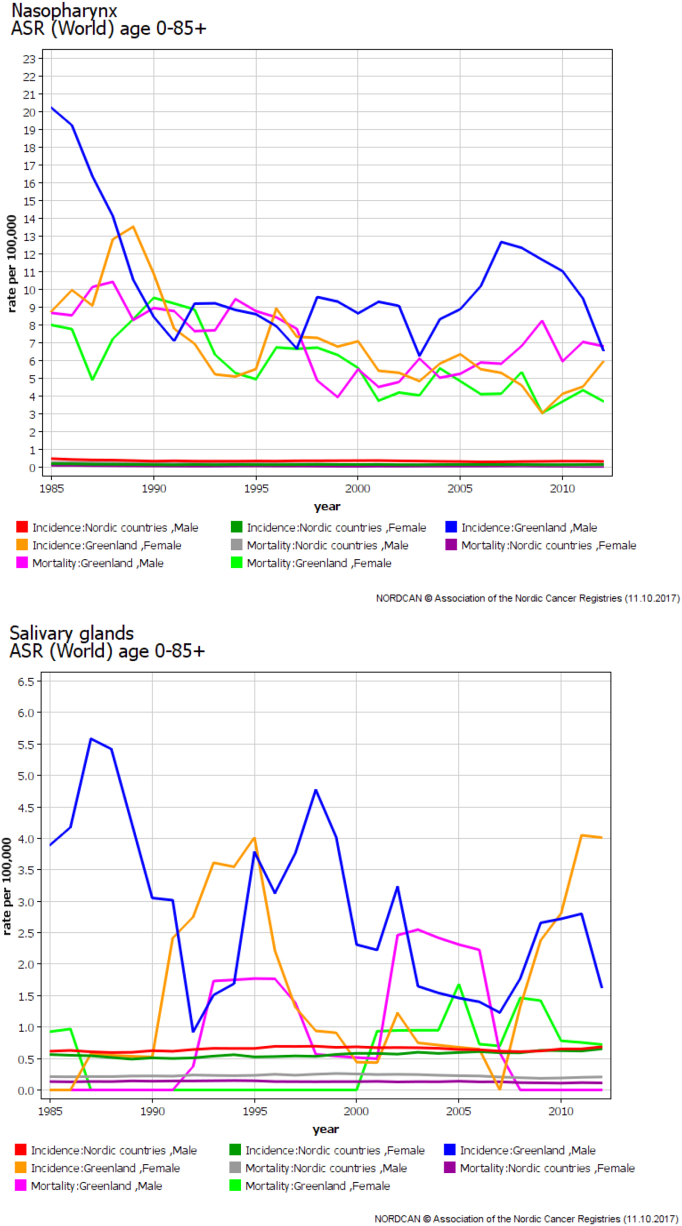
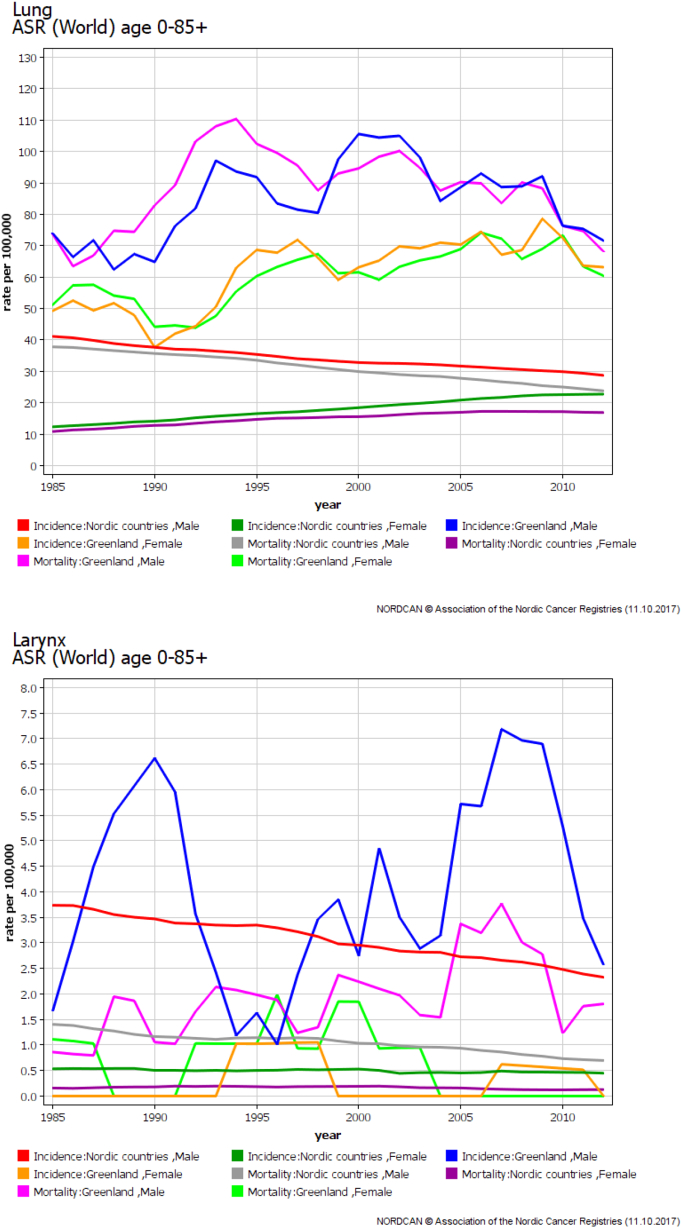
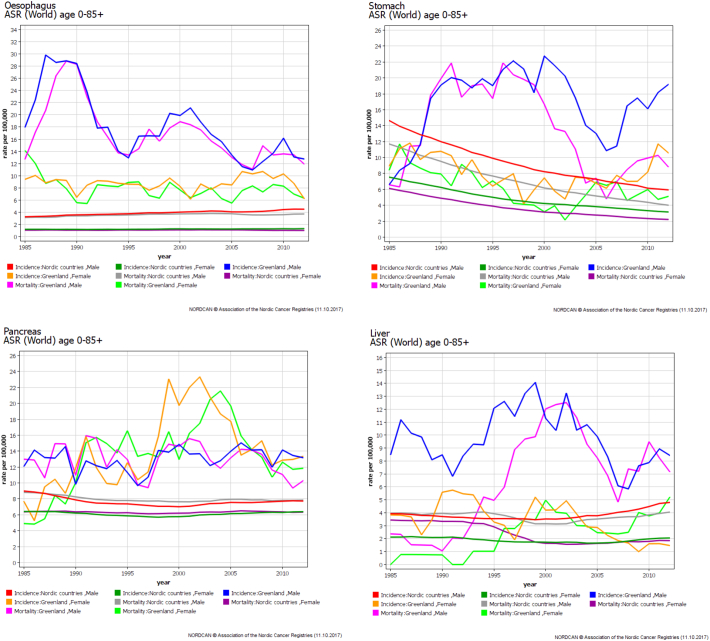
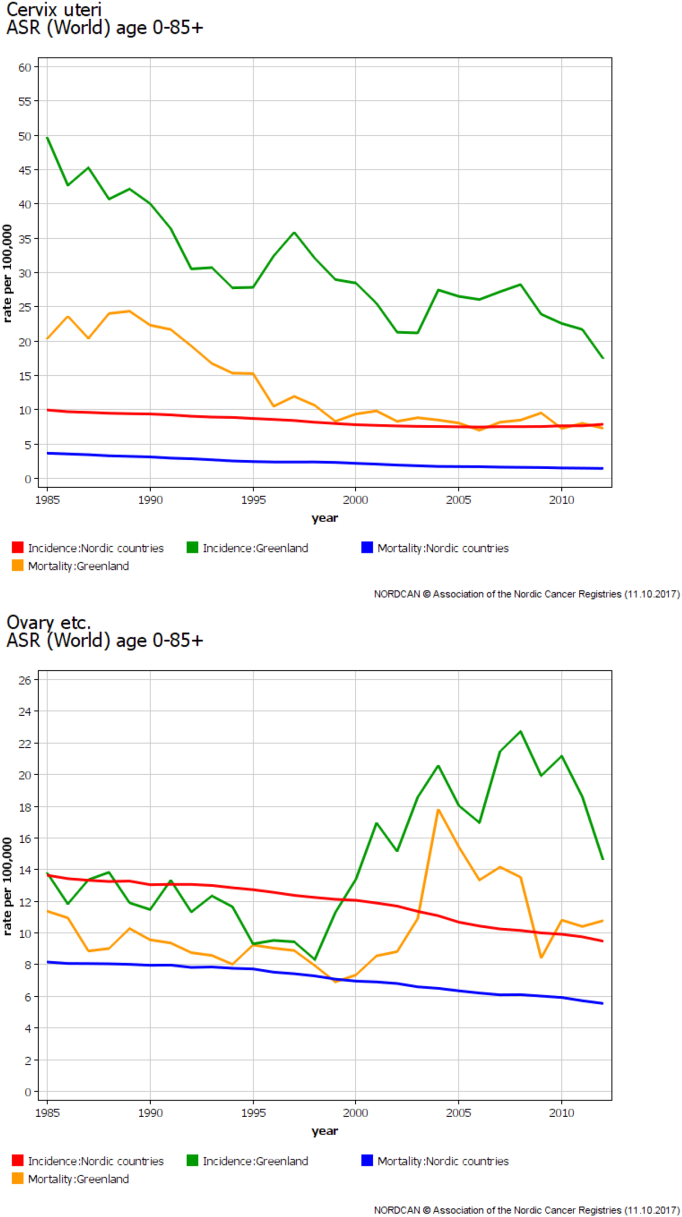
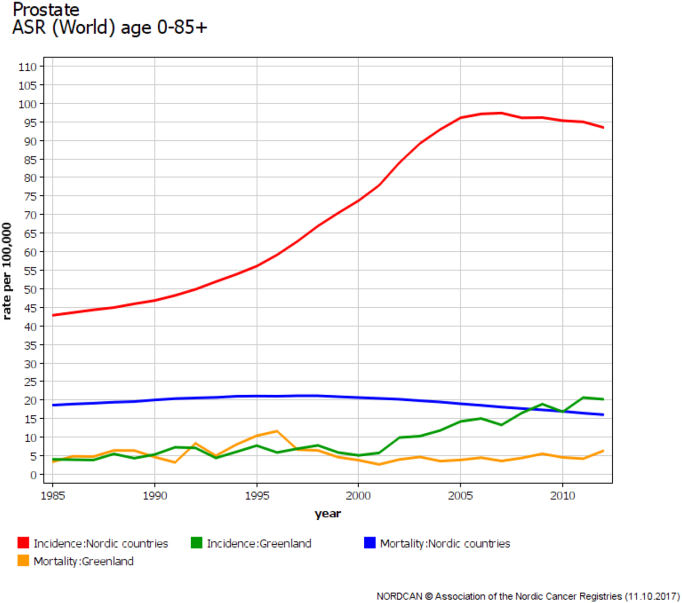
Findings: The total number of cancer cases in Greenland for the study period was 4716 and there were 3231 cancer deaths. Respiratory and gastrointestinal cancers had the highest incidence as well as mortality in Greenland for the entire time period and for both sexes. Compared to the other Nordic countries, Greenland had significantly higher incidence and mortality rates for several cancers. Cancer of the lip, oral cavity, and pharynx, respiratory cancer, and cancer of unknown sites had the highest incidence rate ratios (2.3-3.9) and mortality rate ratios (2.7-9.9) for both sexes. The time trend from 1983 to 2014 showed a significant increase in cancer incidence in Greenland with nearly the same incidence level as the other Nordic countries. While the cancer mortality decreased in the other Nordic countries during the time period studied, there was no change in the cancer-specific mortality in Greenland.
Interpretations: The trends in cancer incidence and mortality in Greenland compared to the other Nordic countries have not been reported earlier. These data underline a need to focus on cancer-specific mortality in Greenland and prevention of high-incidence cancers related to well-established risk factors.
Keywords: Arctic; Cancer; Cancer incidence; Cancer mortality; Carcinoma; Epidemiology; Greenland; Inuit; Nordic countries.
Figures
References
-
- Greenland statistics. 2017. Greenland in figures.http://www.stat.gl/publ/en/GF/2017/pdf/GreenlandinFigures2017.pdf Available from.
-
- Prener A., Nielsen N.H., Storm H.H., Hansen J.P., Jensen O.M. Cancer in Greenland 1953–1985. APMIS Suppl. 1991;20:1–79. - PubMed
-
- Rethinking Greenland and the Arctic in the era of climate change: new Northern Horizons. Routlegde; London & New York: 2015.
-
- Storm H.H., Nielsen N.H., Prener A., Jensen O.M. A comparison of cancer in Greenland and Denmark. A study based on routinely collected incidence data 1973–1985, using the Danish population as baseline. Arctic Med Res. 1991;(Suppl:470–71) - PubMed
-
- Friborg J.T., Melbye M. Cancer patterns in Inuit populations. Lancet Oncol. 2008;9:892–900. - PubMed
LinkOut - more resources
Full Text Sources
Medical
