

Association of Community Factors with Hospital-onset Clostridioides (Clostridium) difficile Infection: A Population Based U.S.-wide Study
- PMID: 31193719
- PMCID: PMC6537581
- DOI: 10.1016/j.eclinm.2019.02.001
Association of Community Factors with Hospital-onset Clostridioides (Clostridium) difficile Infection: A Population Based U.S.-wide Study
Abstract
Background: Clostridioides (Clostridium) difficile ranks first among the pathogens of hospital-acquired infections with hospital-based preventive strategies being only partially successful in containing its spread.
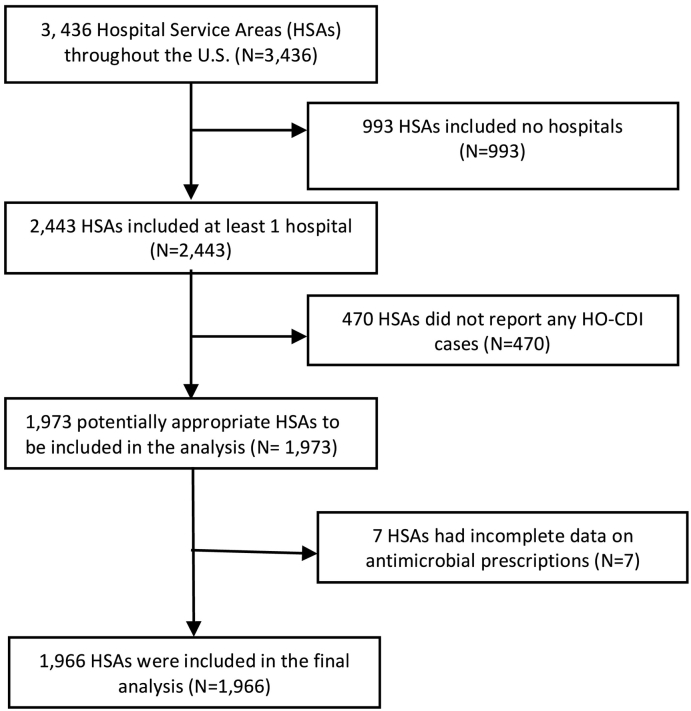
Methods: We performed a spatial statistical analysis to examine the association between population characteristics and parameters of community healthcare practice and delivery with hospital-onset Clostridioides (Clostridium) difficile infection (HO-CDI), using data from the Medicare Hospital Compare, Medicare Provider Utilization Part D, and other databases. Among the areas with the highest HO-CDI rates ("hot spots"), we conducted a geographically weighted regression (GWR) to quantify the effect of the decrease in the modifiable risk factors on the HO-CDI rate.
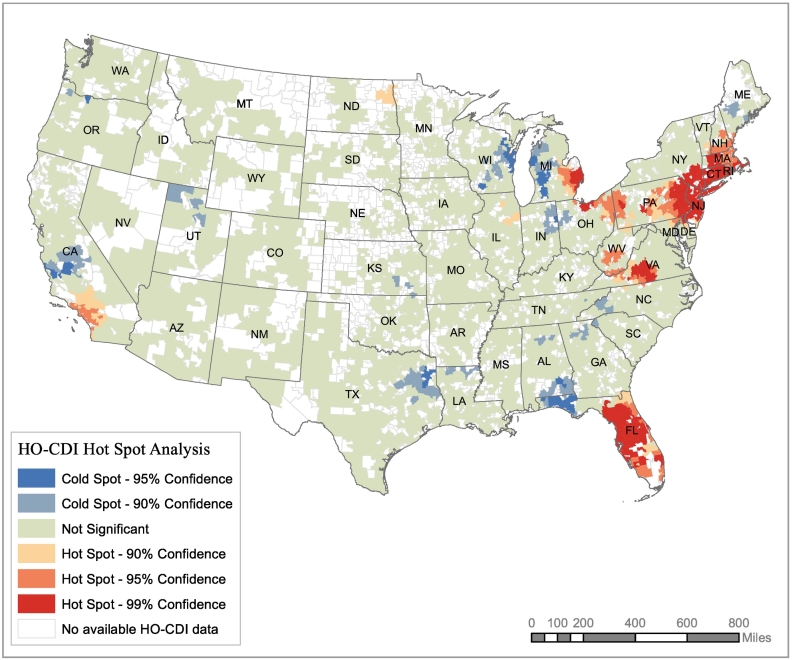
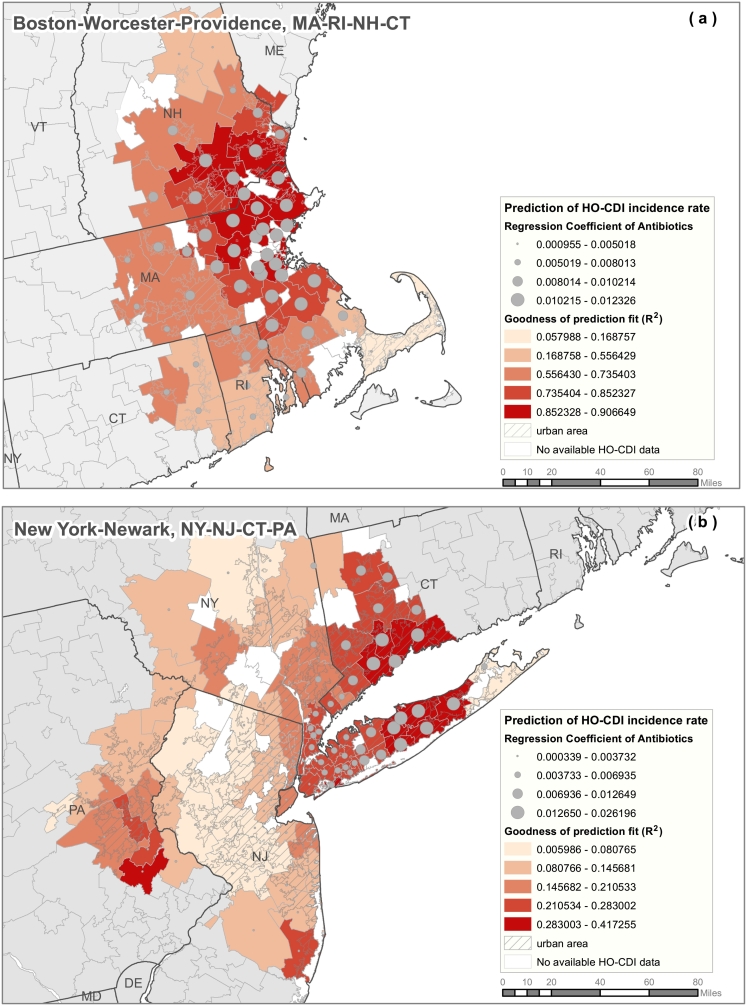
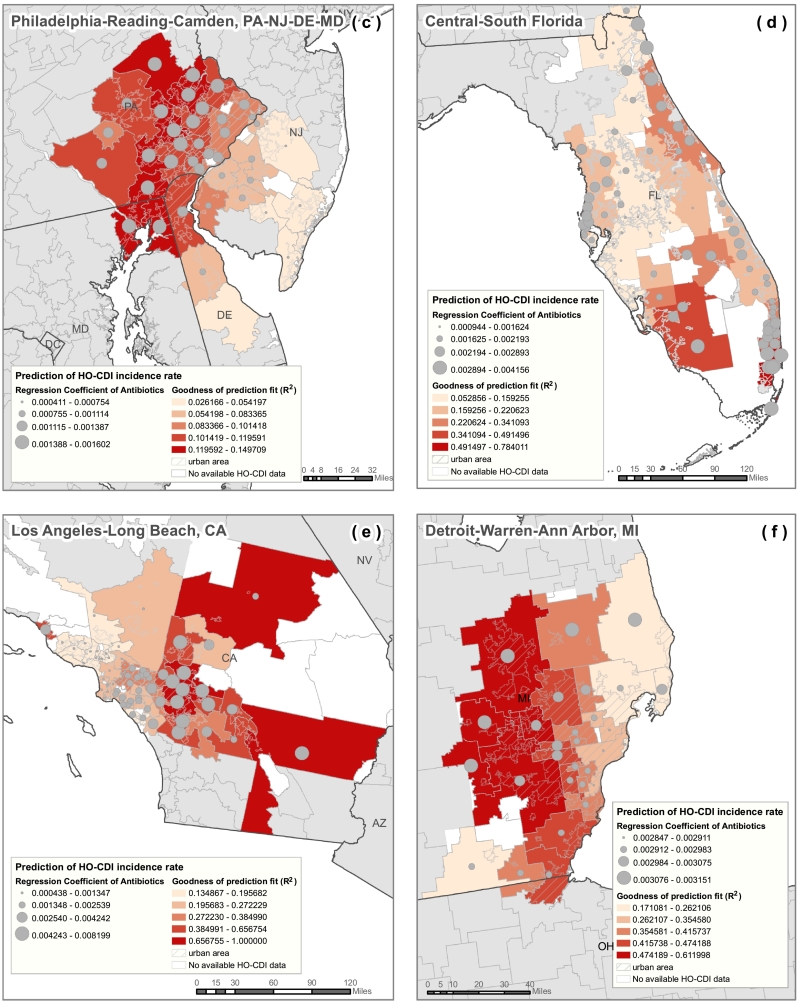
Findings: Percentage of population > 85 years old, community claims of antimicrobial agents and acid suppressants, and density of hospitals and nursing homes within the hospital service areas (HSAs) had a statistically significant association with the HO-CDI incidence (p < 0.001). The model including the community claims of antimicrobial agents and number of hospital centers per HSA km2 was associated with 10% (R2 = 0.10, p < 0.001) of the observed variation in HO-CDI rate. The hot spots were organized into 5 Combined Statistical areas that crossed state borders. The association of the antimicrobial claims and HO-CDI rate was as high as 71% in the Boston-Worcester-Providence area (R2 = 0.71, SD 0.19), with a 10% decrease in the rate of antimicrobial claims having the potential to lead to up to 23.1% decrease in the HO-CDI incidence in this area.
Interpretation: These results outline the association of HO-CDI with community practice and characteristics of the healthcare delivery system and support the need to further study the effect of community and nursing home-based antimicrobial and acid suppressant stewardship programs in the rate of HO-CDI in geographic areas that may cross state lines.
Keywords: CA-CDI, Community-acquired Clostridioides difficile infection; CDC, Centers for Disease Control and Prevention; CDI, Clostridioides difficile infection; CSA, Combined Statistical Area; Clostridioides difficile; Clostridium difficile; Geographically weighted regression model; HO-CDI; HO-CDI, Hospital-onset Clostridioides difficile infection; HSA, Hospital Service Area; PPIs, Proton-Pump Inhibitors; Risk factors; Spatial statistical analysis.
Figures
Similar articles
-
Using diagnostic stewardship to reduce rates, healthcare expenditures and accurately identify cases of hospital-onset Clostridioides difficile infection.Infect Control Hosp Epidemiol. 2021 Jan;42(1):51-56. doi: 10.1017/ice.2020.375. Epub 2020 Sep 18. Infect Control Hosp Epidemiol. 2021. PMID: 32943129 Free PMC article.
-
CDC's Hospital-Onset Clostridioides difficile Prevention Framework in a Regional Hospital Network.JAMA Netw Open. 2024 Mar 4;7(3):e243846. doi: 10.1001/jamanetworkopen.2024.3846. JAMA Netw Open. 2024. PMID: 38536174 Free PMC article.
-
The Effect of Saccharomyces boulardii Primary Prevention on Risk of Hospital-onset Clostridioides difficile Infection in Hospitalized Patients Administered Antibiotics Frequently Associated With C. difficile Infection.Clin Infect Dis. 2021 Nov 2;73(9):e2512-e2518. doi: 10.1093/cid/ciaa808. Clin Infect Dis. 2021. PMID: 32575126
-
Impact of hospital environmental cleaning with a potassium peroxymonosulphate-based environmental disinfectant and antimicrobial stewardship on the reduction of hospital-onset Clostridioides difficile infections.J Hosp Infect. 2022 Nov;129:181-188. doi: 10.1016/j.jhin.2022.06.018. Epub 2022 Jul 9. J Hosp Infect. 2022. PMID: 35820556 Review.
-
Burden of Clostridioides difficile infection (CDI) - a systematic review of the epidemiology of primary and recurrent CDI.BMC Infect Dis. 2021 May 19;21(1):456. doi: 10.1186/s12879-021-06147-y. BMC Infect Dis. 2021. PMID: 34016040 Free PMC article.
Cited by
-
Development of a Prediction Model to Identify the Risk of Clostridioides difficile Infection in Hospitalized Patients Receiving at Least One Dose of Antibiotics.Pharmacy (Basel). 2024 Feb 19;12(1):37. doi: 10.3390/pharmacy12010037. Pharmacy (Basel). 2024. PMID: 38392945 Free PMC article.
-
Health care resource utilization and costs of recurrent Clostridioides difficile infection in the elderly: a real-world claims analysis.J Manag Care Spec Pharm. 2021 Jul;27(7):828-838. doi: 10.18553/jmcp.2021.20395. Epub 2021 Mar 11. J Manag Care Spec Pharm. 2021. PMID: 33703939 Free PMC article.
-
Risk Factors for Hospital Readmission for Clostridioides difficile Infection: A Statewide Retrospective Cohort Study.Pathogens. 2022 May 8;11(5):555. doi: 10.3390/pathogens11050555. Pathogens. 2022. PMID: 35631075 Free PMC article.
-
Prescribing trends of proton pump inhibitors, antipsychotics and benzodiazepines of medicare part d providers.BMC Geriatr. 2022 Apr 9;22(1):306. doi: 10.1186/s12877-022-02971-2. BMC Geriatr. 2022. PMID: 35395728 Free PMC article.
References
-
- Centers for Disease Control and Prevention Antibiotic resistance threats in the United States, 2013. http://www.cdc.gov/drugresistance/threat-report-2013/pdf/ar-threats-2013... [accessed January 5 2018]
-
- McDonald L.C., Gerding D.N., Johnson S. Clinical practice guidelines for Clostridium difficile infection in adults and children: 2017 update by the Infectious Diseases Society of America (IDSA) and Society for Healthcare Epidemiology of America (SHEA) Clin Infect Dis. 2018;66(7):e1–e48. - PMC - PubMed
LinkOut - more resources
Full Text Sources
