. 2019 May;9(3):575-589.
doi: 10.1016/j.apsb.2018.12.009. Epub 2018 Dec 26.

Neutrophil-mimicking therapeutic nanoparticles for targeted chemotherapy of pancreatic carcinoma

Affiliations

Neutrophil-mimicking therapeutic nanoparticles for targeted chemotherapy of pancreatic carcinoma

Xi Cao et al. Acta Pharm Sin B. 2019 May.

Abstract

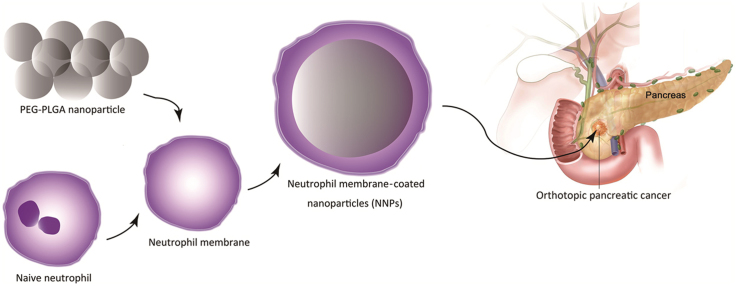
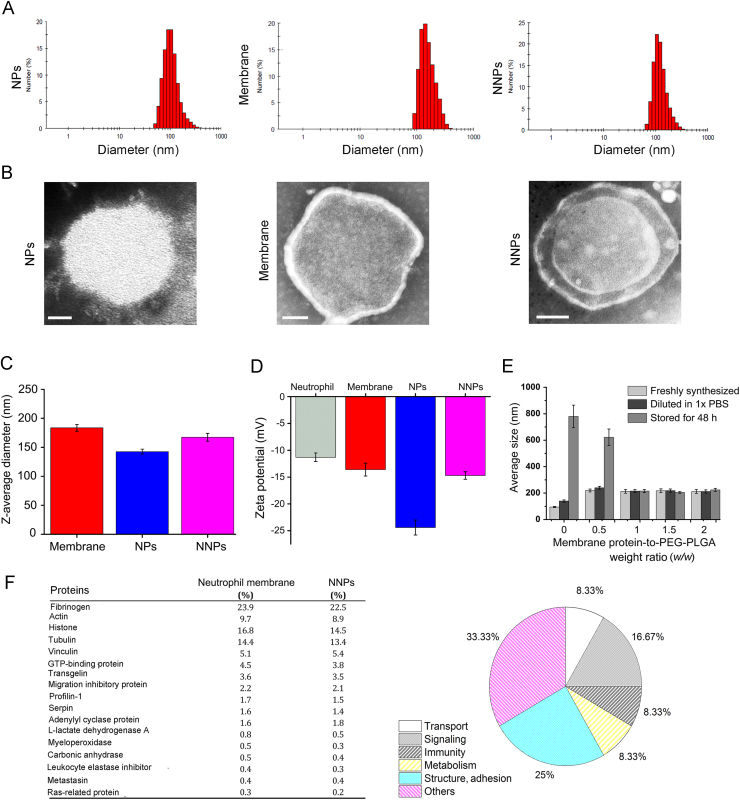
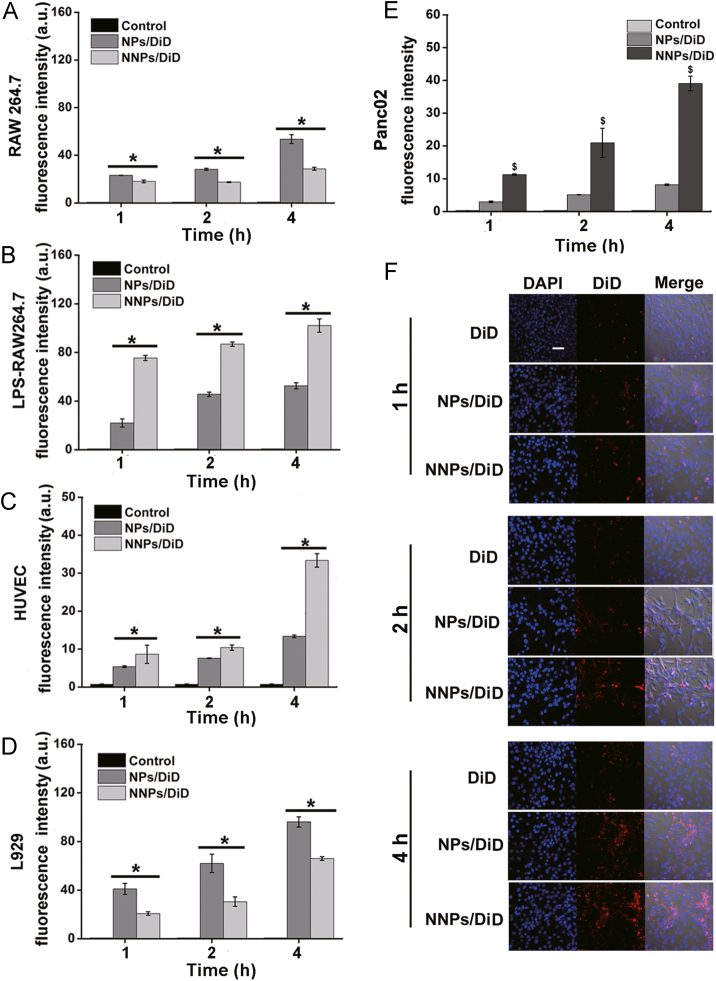
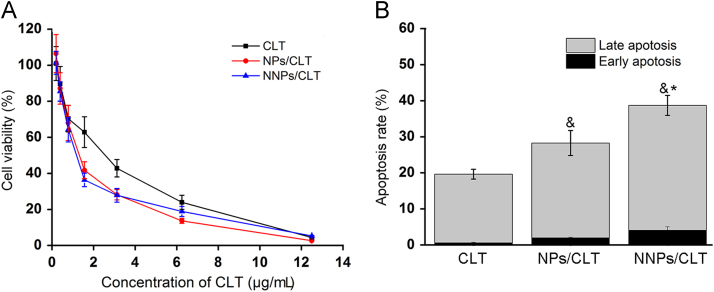
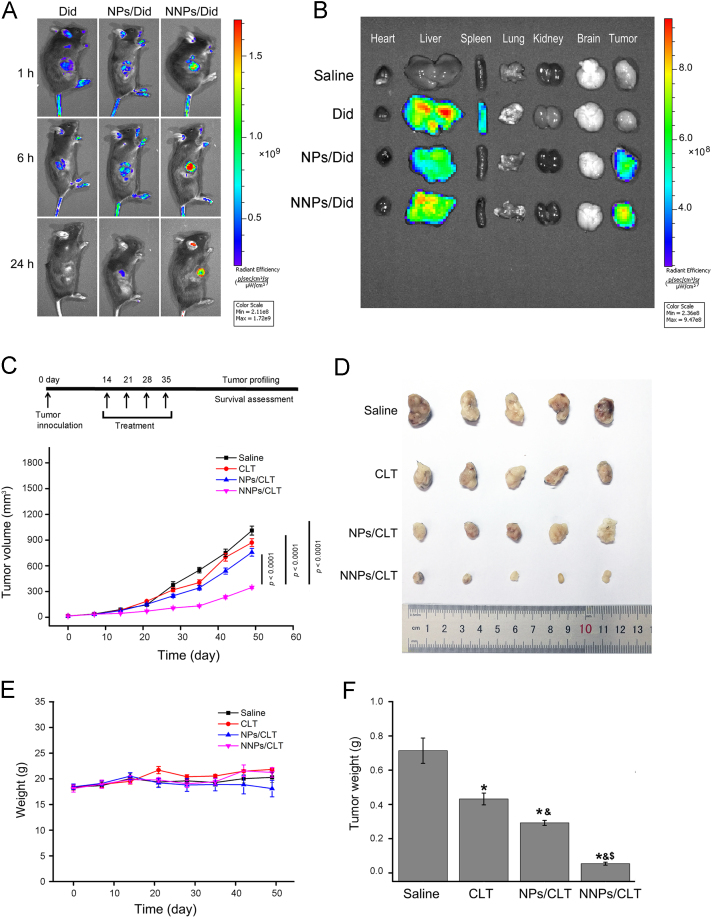
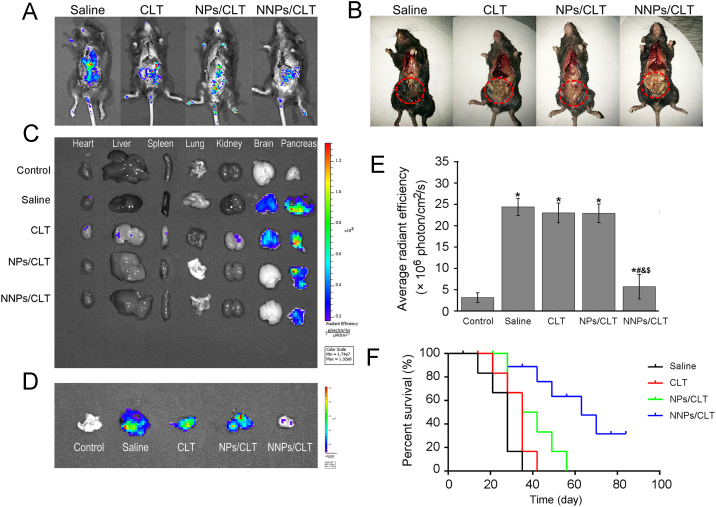
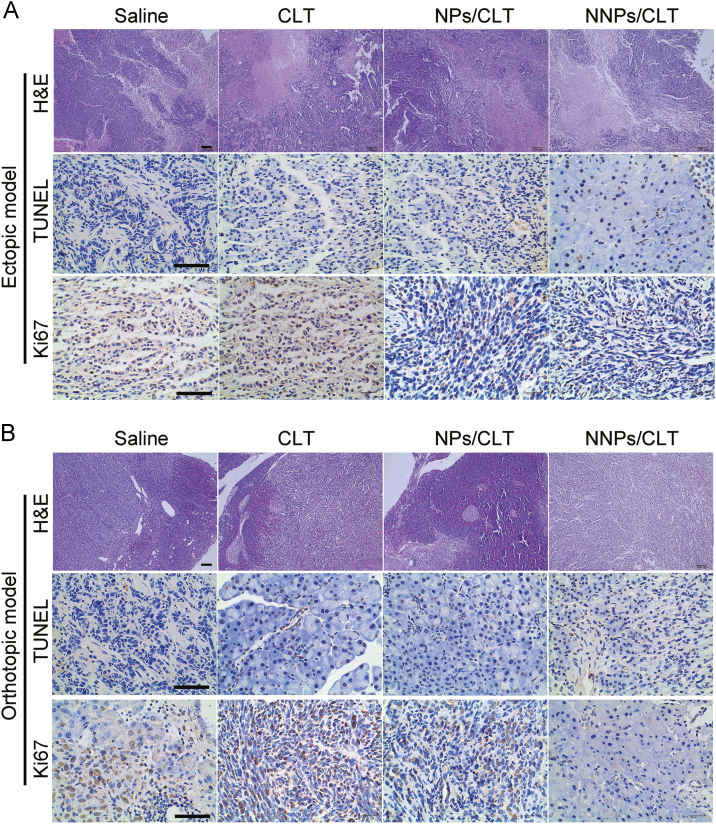
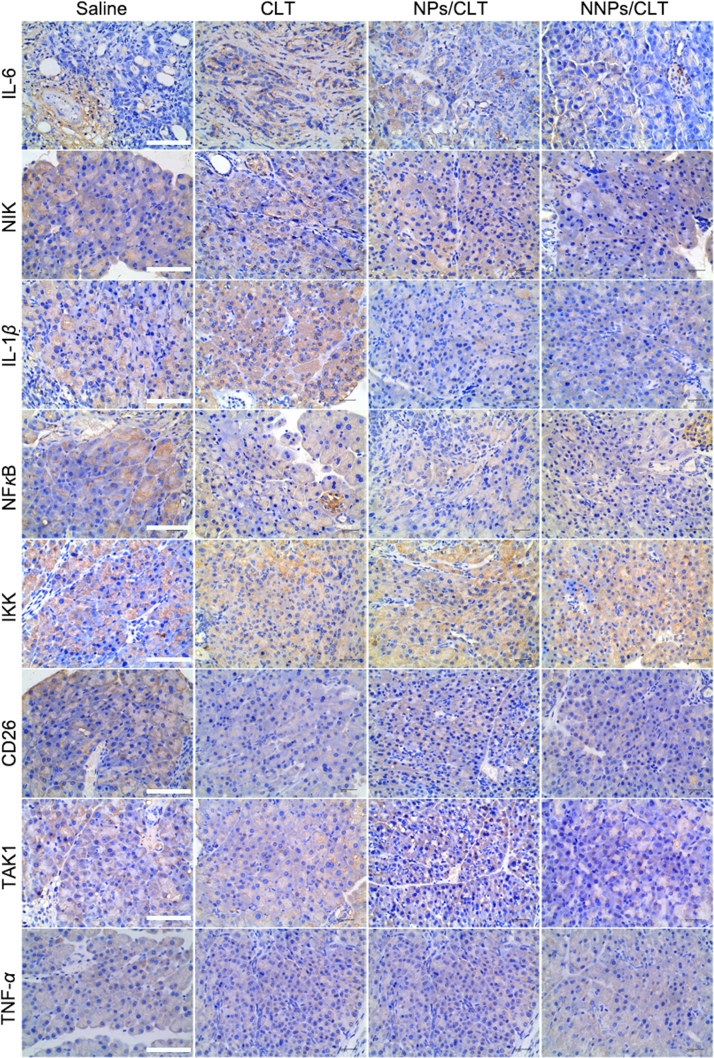
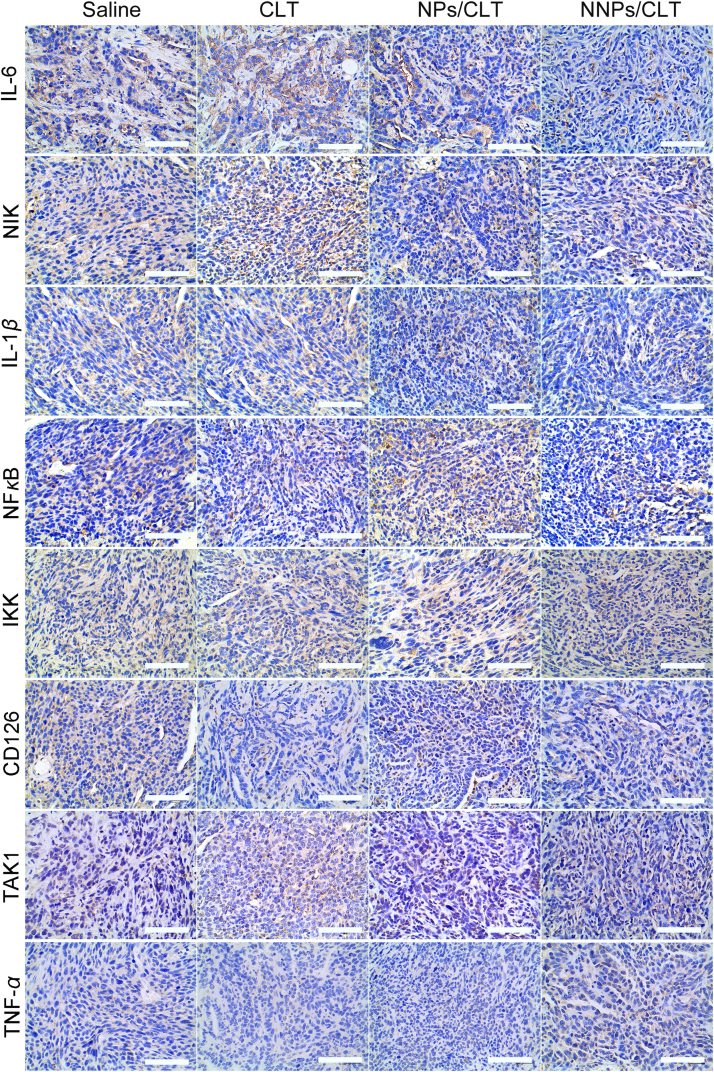
Due to the critical correlation between inflammation and carcinogenesis, a therapeutic candidate with anti-inflammatory activity may find application in cancer therapy. Here, we report the therapeutic efficacy of celastrol as a promising candidate compound for treatment of pancreatic carcinoma via naïve neutrophil membrane-coated poly(ethylene glycol) methyl ether-block-poly(lactic-co-glycolic acid) (PEG-PLGA) nanoparticles. Neutrophil membrane-coated nanoparticles (NNPs) are well demonstrated to overcome the blood pancreas barrier to achieve pancreas-specific drug delivery in vivo. Using tumor-bearing mice xenograft model, NNPs showed selective accumulations at the tumor site following systemic administration as compared to nanoparticles without neutrophil membrane coating. In both orthotopic and ectopic tumor models, celastrol-loaded NNPs demonstrated greatly enhanced tumor inhibition which significantly prolonged the survival of tumor bearing mice and minimizing liver metastases. Overall, these results suggest that celastrol-loaded NNPs represent a viable and effective treatment option for pancreatic carcinoma.

Keywords: 5-FU, fluorouracil; CLT, celastrol; Celastrol; DAPI, 4′,6-diamidino-2-phenylindole; DiD, 1,1′-dioctadecyl-3,3,3′,3′-tetramethylindodicarbocyanine perchlorate; IKKα, IκB kinase α; IKKβ, IκB kinase β; IL-1β, interleukin 1 beta; IL-6, interleukin 6; Inflammation; NF-κB, nuclear factor kappa B; NIK, NF kappa B inducing kinase; NNPs, neutrophil membrane-coated nanoparticles; NPs, nanoparticles without neutrophil membrane coating; Naïve neutrophils membrane; PEG-PLGA nanoparticle; PEG-PLGA, poly(ethylene glycol) methyl ether-block-poly(lactic-co-glycolic acid); PI, propidium iodide; Pancreatic carcinoma; TAK1, TGF-β-activated kinase 1; TEM, transmission electronic microscopy; TNF-α, tumor necrosis factor alpha.


Figures

fx1
Graphical abstract
Fig. 1
Figure 1
Physicochemical characterizations of nanoparticles. (A) Size distributions of NPs, membrane, and NNPs as determined by DLS. (B) TEM images of NPs, membrane, and NNPs. Scale bars represent 30 nm. (C) Hydrodynamic size of PEG-PLGA NPs cores, membrane vesicles, and NNPs. Data represent mean±SD (n=3). (D) Surface ζ potential of neutrophils, PEG-PLGA NPs cores, membrane vesicles, and NNPs. Data represent means±SD (n=3). (E) Hydrodynamic size of NNPs as measured by DLS at varying membrane protein to PEG-PLGA weight ratios after adjusting to 1× PBS, and after storage for 48 h in 1× PBS. Data represent means±SD (n=3). (F) Comparative proteomic study of plasma membrane proteins of neutrophils and NNPs.
Fig. 2
Figure 2
Cellular uptake behaviors in various cell lines. Cellular uptake of NPs/DiD, and NNPs/DiD in (A) murine macrophage RAW264.7, (B) LPS treated RAW264.7, (C) HUVEC, (D) L929; and (E) Panc02 cells at 1, 2, and 4 h. (F) Confocal laser scanning microscopy images of Panc02. Cell nuclei were stained with DAPI (blue) and DiD fluorescence displayed in red. Scale bar represents 100 μm. Data represent mean±SD (n=3). *P<0.05 vs. NPs/DiD.
Fig. 3
Figure 3
Cytotoxicity and apoptosis. (A) Viability of Panc02 cells after 24 h of treatment of CLT solution, NPs/CLT and NNPs/CLT. (B) Cell apoptosis and necrosis percentages were analyzed by flow cytometry using annexin V-FITC in combination with PI in Panc02 cells after treatment with different formulations. Data represent mean±SD (n=3). &P<0.05 vs. CLT, *P<0.05 vs. NPs/CLT.
Fig. 4
Figure 4
Antitumor efficacy of NNPs/CLT in mice bearing Panc02 xenografts. (A) In vivo imaging of tumor bearing mice at 1, 6 and 24 h after i.v. injections of DiD solution, NPs/Did and NNPs/Did. (B) Representative images of vital organs and tumors 24 h after i.v. injections of DiD solution, NPs/Did and NNPs/Did. (C) Dosing regime and average volumes of tumors after different treatments over time. Data represent mean±SD (n=5). (D) Morphology of tumors in different treatment groups after 35 days. (E) Body weight variations of each treatment group over time. (F) Tumor weight variations of each treatment group over time. Data represent mean±SD (n=5). *P < 0.05 vs. normal, &P < 0.05 vs. CLT, and $P < 0.05 vs. NPs/CLT.
Fig. 5
Figure 5
In vivo antitumor efficacy in mice bearing GFP-Panc02 orthotopic tumor model. (A) Whole-body fluorescence imaging of mice with surgically open abdomen. Mice were sacrificed on day 35 after indicated treatments. (B) Photo images of the disease conditions after indicated treatment. (C) Representative fluorescence images of vital organs and pancreas. (D) Representative fluorescent images of tumor-bearing pancreas. (E) Semiquantitative analysis of fluorescence intensity of the pancreas. Data represent mean±SD (n=5). *P<0.05 vs. normal, #P<0.05 vs. model, &P<0.05 vs. CLT, and $P<0.05 vs. NPs/CLT. (F) Survival times in different treatment groups (n=10).
Fig. 6
Figure 6
In vivo toxicity and therapeutic effect in ectopic pancreatic cancer model. The major organs and tissues were collected for H&E staining and histological analysis. These are representative sections from five mice analyzed for each condition. Scale bar=100 µm.
Fig. 7
Figure 7
In vivo toxicity and therapeutic effect in orthotopic pancreatic cancer model. The major organs and tissues were collected for H&E staining and histological analysis. Liver metastatic nests were pointed out by white arrows. These are representative sections from five mice analyzed for each condition. Scale bar=100 µm.
Fig. 8
Figure 8
Immunohistochemistry staining of tumor sections of ectopic pancreatic cancer model (A) and orthotopic pancreatic cancer model (B). Scale bars represent 100 μm.
Fig. 9
Figure 9
Immunohistochemistry of IL-6, NIK, IL-1β, NF-κB, IKK, CD126, TAK1 and TNF-α staining of tumor sections in the ectopic pancreatic cancer model. Scale bar=100 μm.
Fig. 10
Figure 10
Immunohistochemistry of IL-6, NIK, IL-1β, NF-κB, IKK, CD126, TAK1 and TNF-α staining of tumor sections in the orthotopic pancreatic tumor mice model. Scale bar=100 μm.

Similar articles

Cited by

References

    1. Ryan D.P., Hong T.S., Bardeesy N. Pancreatic adenocarcinoma. N Engl J Med. 2014;371:1039–1049. - PubMed
    1. Peery A.F., Crockett S.D., Barritt A.S., Dellon E.S., Eluri S., Gangarosa L.M. Burden of gastrointestinal, liver, and pancreatic diseases in the United States. Gastroenterology. 2015;149:1731–1741. e. - PMC - PubMed
    1. Kamisawa T., Wood L.D., Itoi T., Takaori K. Pancreatic cancer. Lancet. 2016;388:73–85. - PubMed
    1. Sato N., Cheng X.B., Kohi S., Koga A., Hirata K. Targeting hyaluronan for the treatment of pancreatic ductal adenocarcinoma. Acta Pharm Sin B. 2016;6:101–105. - PMC - PubMed
    1. Zhang S.H., Zhang H., He H.W., Li Y., Li X.Y., Zhang L.F. In vivo real-time imaging of gemcitabine-leaded growth inhibition in the orthotopic transplantation model of human pancreatic tumor. Acta Pharm Sin B. 2011;1:220–225.