

Inhibition of FOXO3a/BIM signaling pathway contributes to the protective effect of salvianolic acid A against cerebral ischemia/reperfusion injury
- PMID: 31193821
- PMCID: PMC6543034
- DOI: 10.1016/j.apsb.2019.01.010
Inhibition of FOXO3a/BIM signaling pathway contributes to the protective effect of salvianolic acid A against cerebral ischemia/reperfusion injury
Abstract
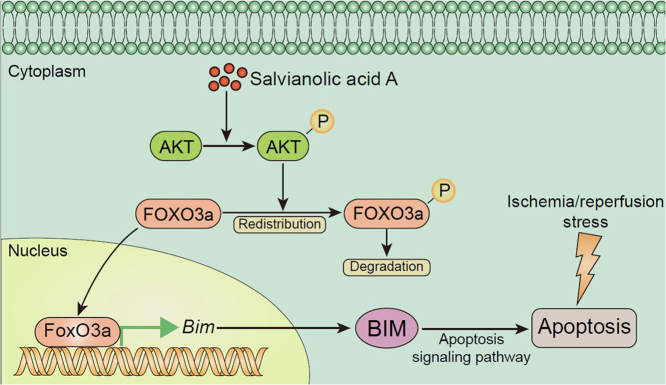
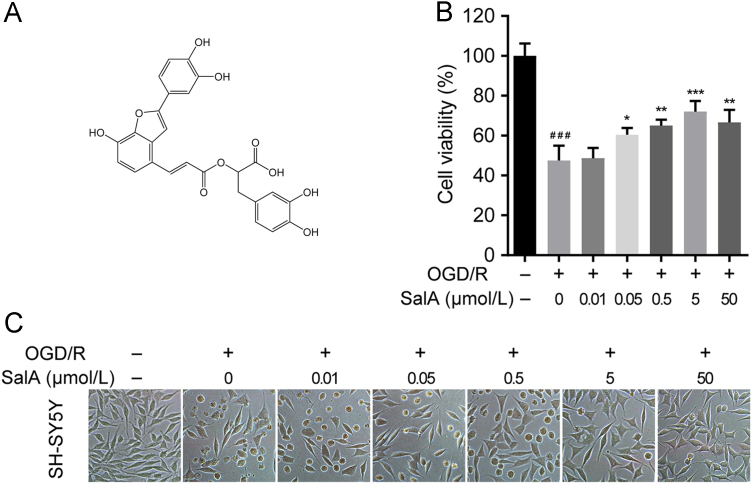
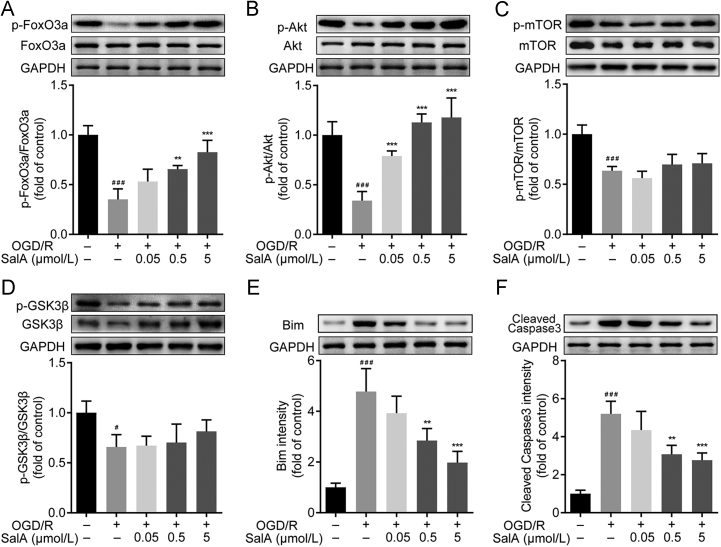
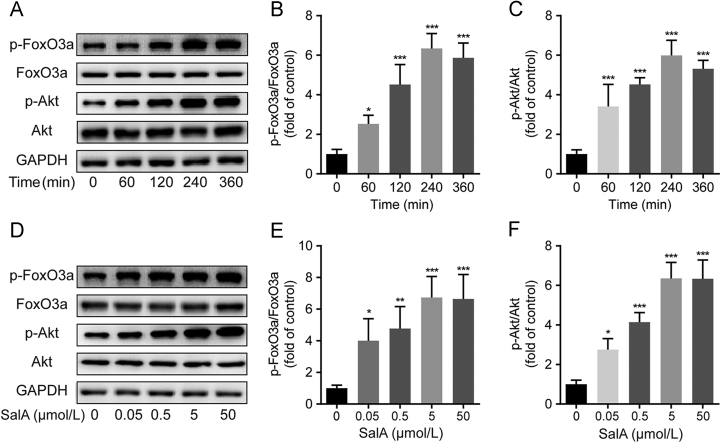
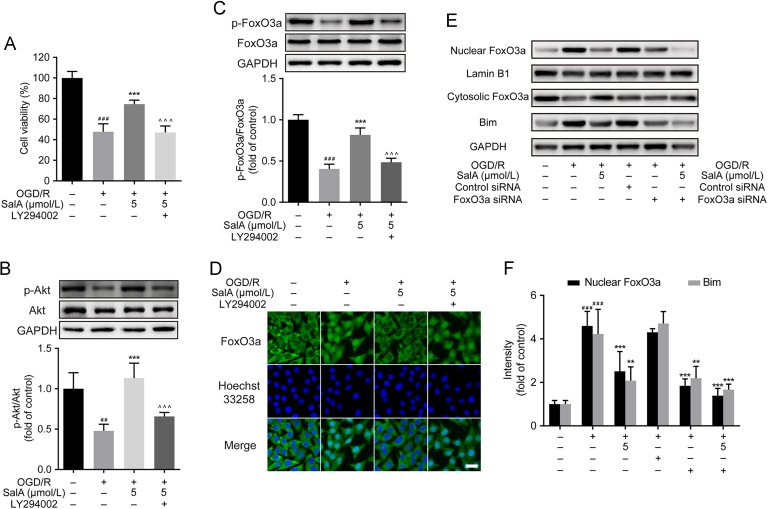
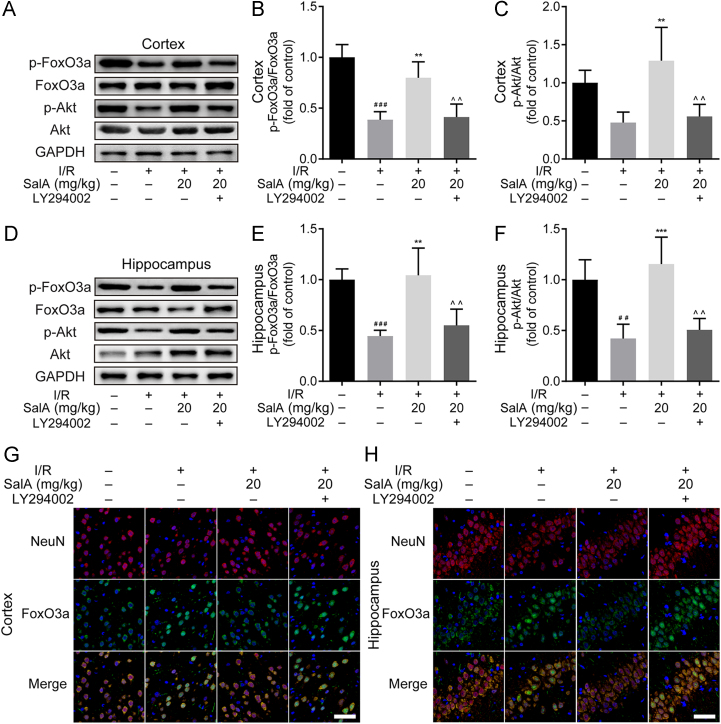
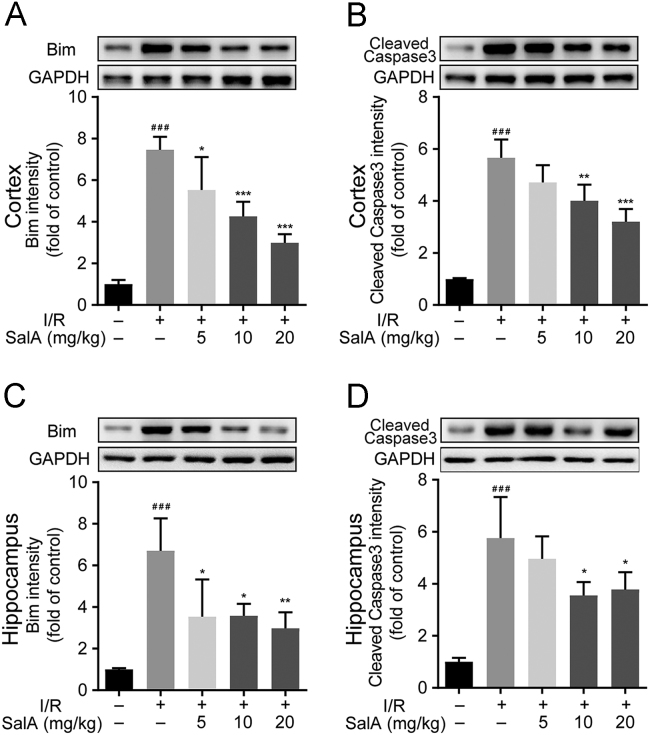
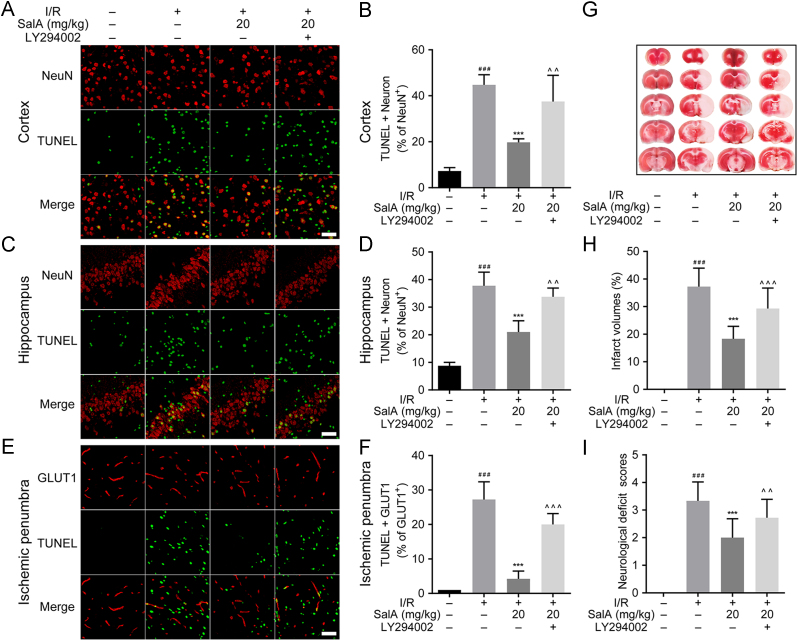
Salvianolic acid A (SalA) is an effective compound extracted from traditional Chinese medicine Salvia miltiorrhiza Bunge. The Forkhead box O3a (FOXO3a) signaling pathway plays crucial roles in the modulation of ischemia-induced cell apoptosis. However, no information about the regulatory effect of SalA on FoxO3a is available. To explore the anti-cerebral ischemia effect and clarify the therapeutic mechanism of SalA, SH-SY5Y cells and Sprague-Dawley rats were applied, which were exposed to oxygen glucose deprivation/reoxygenation (OGD/R) and middle cerebral artery occlusion/reperfusion (MCAO/R) injuries, respectively. The involved pathway was identified using the specific inhibitor LY294002. Results showed that SalA concentration-dependently inhibited OGD/R injury triggered cell viability loss. SalA reduced cerebral infarction, lowered brain edema, improved neurological function, and inhibited neuron apoptosis in MCAO/R rats, which were attenuated by the treatment of phosphatidylinositol-4,5-bisphosphate 3-kinase (PI3K) specific inhibitor LY294002. SalA time- and concentration-dependently upregulated the phosphorylation levels of protein kinase B (AKT) and its downstream protein FOXO3a. Moreover, the nuclear translocation of FOXO3a was inhibited by SalA both in vivo and in vitro, which was also reversed by LY294002. The above results indicated that SalA fought against ischemia/reperfusion damage at least partially via the AKT/FOXO3a/BIM pathway.
Keywords: BIM; FOXO3a; Ischemia reperfusion; Neuroprotection; Salvianolic acid A.
Figures
Similar articles
-
PI3K/Akt pathway contributes to neuroprotective effect of Tongxinluo against focal cerebral ischemia and reperfusion injury in rats.J Ethnopharmacol. 2016 Apr 2;181:8-19. doi: 10.1016/j.jep.2016.01.028. Epub 2016 Jan 22. J Ethnopharmacol. 2016. PMID: 26805466
-
PI3K/AKT activation attenuates acute kidney injury following liver transplantation by inducing FoxO3a nuclear export and deacetylation.Life Sci. 2021 May 1;272:119119. doi: 10.1016/j.lfs.2021.119119. Epub 2021 Jan 26. Life Sci. 2021. PMID: 33508296
-
Preactivation of Notch1 in remote ischemic preconditioning reduces cerebral ischemia-reperfusion injury through crosstalk with the NF-κB pathway.J Neuroinflammation. 2019 Sep 16;16(1):181. doi: 10.1186/s12974-019-1570-9. J Neuroinflammation. 2019. PMID: 31526384 Free PMC article.
-
Targeting post-stroke neuroinflammation with Salvianolic acid A: molecular mechanisms and preclinical evidence.Front Immunol. 2024 Jul 30;15:1433590. doi: 10.3389/fimmu.2024.1433590. eCollection 2024. Front Immunol. 2024. PMID: 39139557 Free PMC article. Review.
-
The role of Foxo3a in neuron-mediated cognitive impairment.Front Mol Neurosci. 2024 Jun 19;17:1424561. doi: 10.3389/fnmol.2024.1424561. eCollection 2024. Front Mol Neurosci. 2024. PMID: 38962803 Free PMC article. Review.
Cited by
-
Perspectives for Forkhead box transcription factors in diabetic cardiomyopathy: Their therapeutic potential and possible effects of salvianolic acids.Front Cardiovasc Med. 2022 Aug 11;9:951597. doi: 10.3389/fcvm.2022.951597. eCollection 2022. Front Cardiovasc Med. 2022. PMID: 36035917 Free PMC article. Review.
-
Neuroprotective Effect of Salvianolic Acid C in Neonatal Rats Following Hypoxic-ischemic Brain Damage.Mol Neurobiol. 2025 Jun 16. doi: 10.1007/s12035-025-05030-0. Online ahead of print. Mol Neurobiol. 2025. PMID: 40522382
-
Neuroprotective effects of acetophenone dimers from Acronychia pedunculata on human neuroblastoma SH-SY5Y cells in glutamate-induced apoptosis.J Nat Med. 2025 Jul;79(4):938-949. doi: 10.1007/s11418-025-01920-8. Epub 2025 Jun 2. J Nat Med. 2025. PMID: 40451969
-
Natural herbal extract roles and mechanisms in treating cerebral ischemia: A systematic review.Front Pharmacol. 2024 Aug 2;15:1424146. doi: 10.3389/fphar.2024.1424146. eCollection 2024. Front Pharmacol. 2024. PMID: 39156109 Free PMC article.
-
Anti-apoptosis effect of traditional Chinese medicine in the treatment of cerebral ischemia-reperfusion injury.Apoptosis. 2023 Jun;28(5-6):702-729. doi: 10.1007/s10495-023-01824-6. Epub 2023 Mar 9. Apoptosis. 2023. PMID: 36892639 Review.
References
-
- Feigin V.L., Lawes C.M., Bennett D.A., Anderson C.S. Stroke epidemiology: a review of population-based studies of incidence, prevalence, and case-fatality in the late 20th century. Lancet Neurol. 2003;2:43–53. - PubMed
-
- Hlavica M., Diepers M., Garcia-Esperon C., Ineichen B.V., Nedeltchev K., Kahles T. Pharmacological recanalization therapy in acute ischemic stroke—evolution, current state and perspectives of intravenous and intra-arterial thrombolysis. J Neuroradiol. 2015;42:30–46. - PubMed
-
- Chamorro Á., Dirnagl U., Urra X., Planas A.M. Neuroprotection in acute stroke: targeting excitotoxicity, oxidative and nitrosative stress, and inflammation. Lancet Neurol. 2016;15:869–881. - PubMed
LinkOut - more resources
Full Text Sources
Research Materials
