. 2019 May 20:10:10-31.
doi: 10.1016/j.eclinm.2019.04.006. eCollection 2019 Apr.

Cost-effectiveness of HIV Prevention Interventions in Sub-Saharan Africa: A Systematic Review

Affiliations

Cost-effectiveness of HIV Prevention Interventions in Sub-Saharan Africa: A Systematic Review

Supriya Sarkar et al. EClinicalMedicine. .

Abstract

Background: Sub-Saharan Africa carries the highest HIV burden globally. It is important to understand how interventions cost-effectively fit within guidelines and implementation plans, especially in low- and middle-income settings. We reviewed the evidence from economic evaluations of HIV prevention interventions in sub-Saharan Africa to help inform the allocation of limited resources.

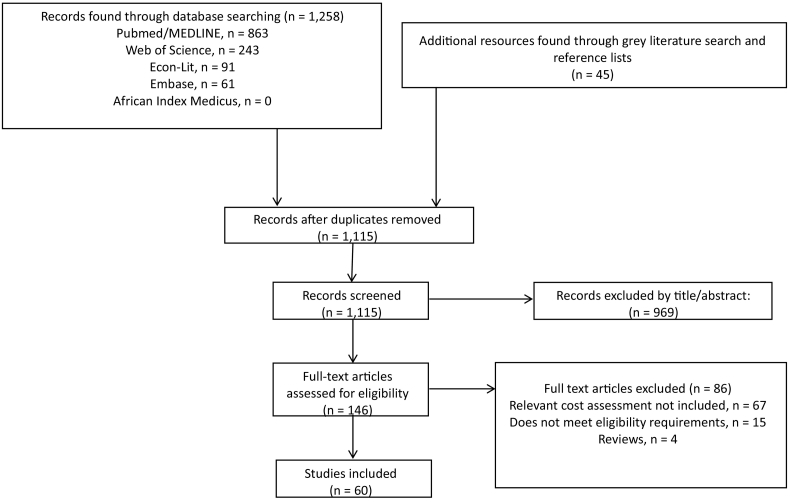
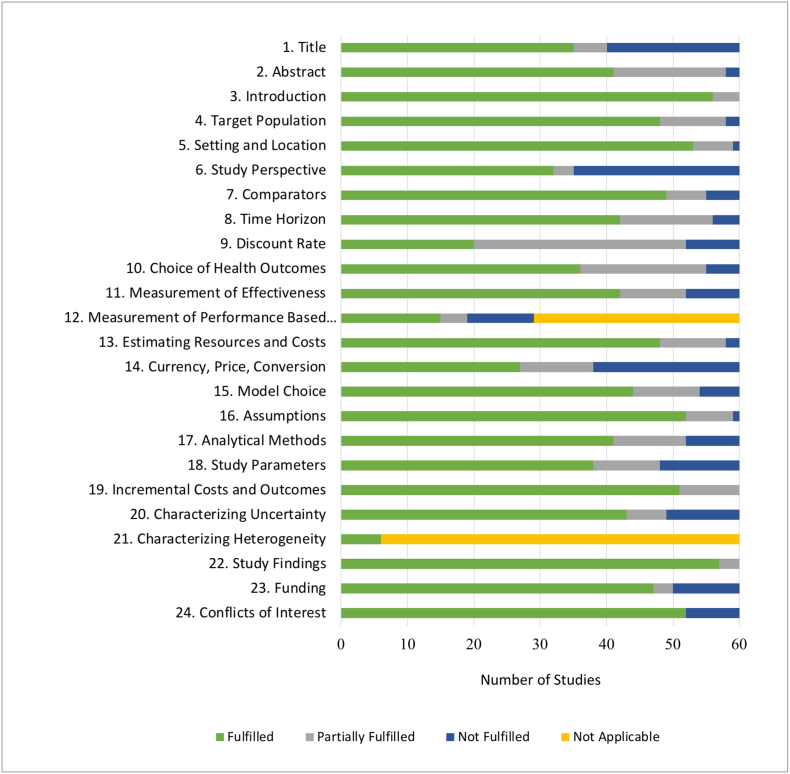
Methods: We searched PubMed, Web of Science, Econ-Lit, Embase, and African Index Medicus. We included studies published between January 2009 and December 2018 reporting cost-effectiveness estimates of HIV prevention interventions. We extracted health outcomes and cost-effectiveness ratios (CERs) and evaluated study quality using the CHEERS checklist.

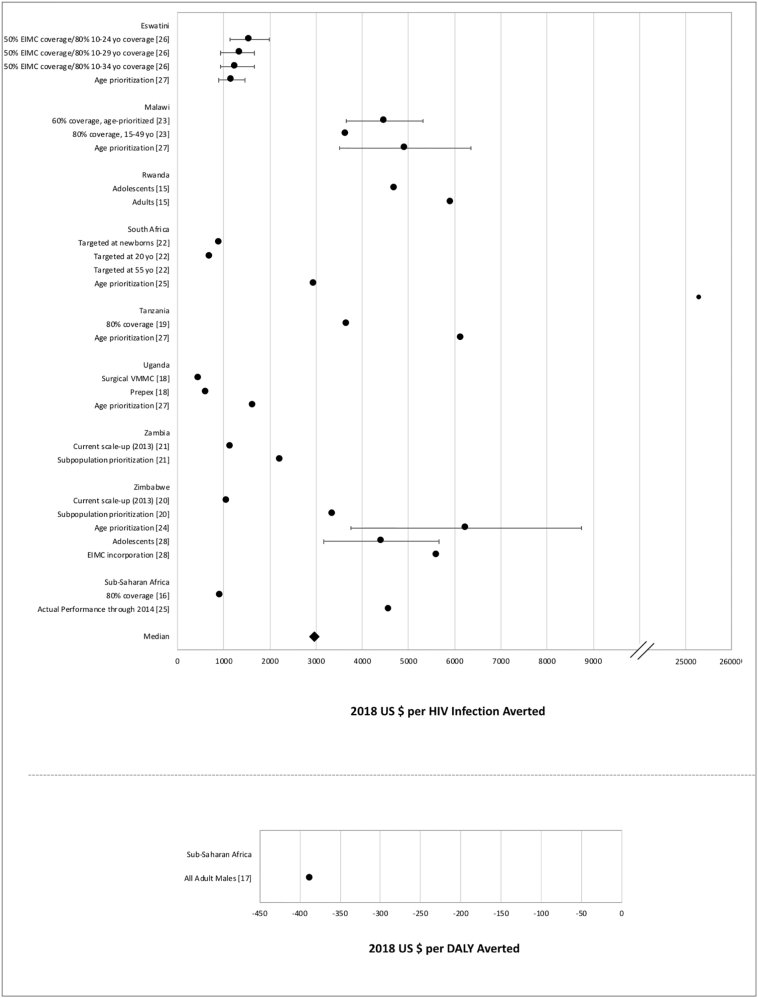
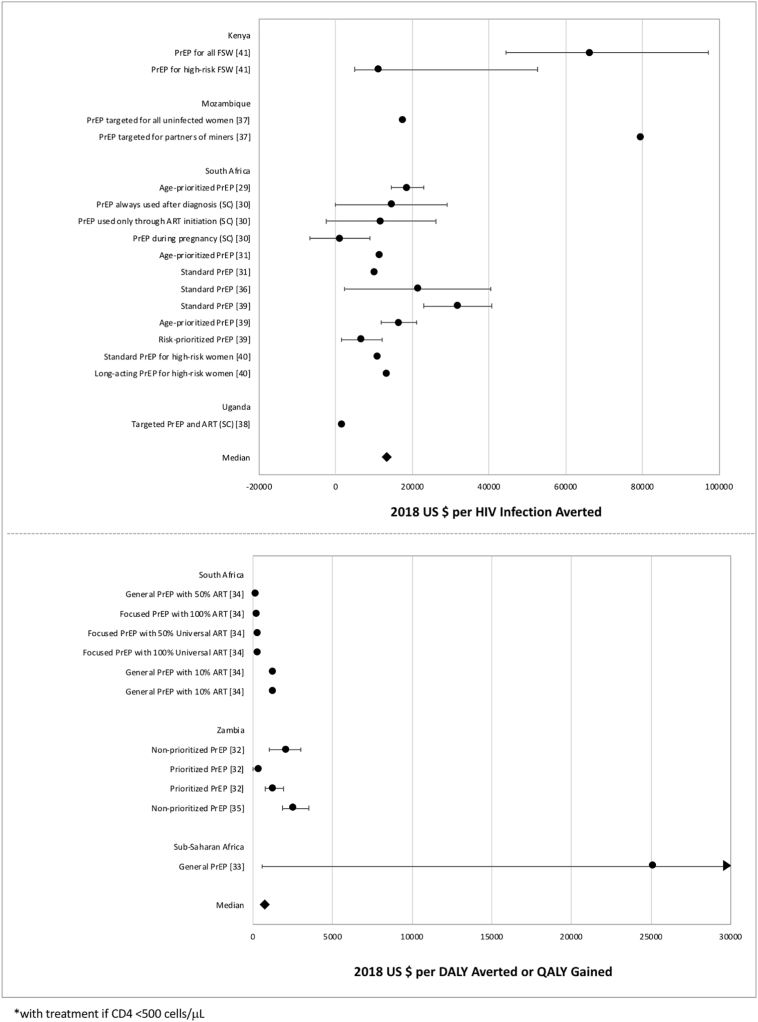
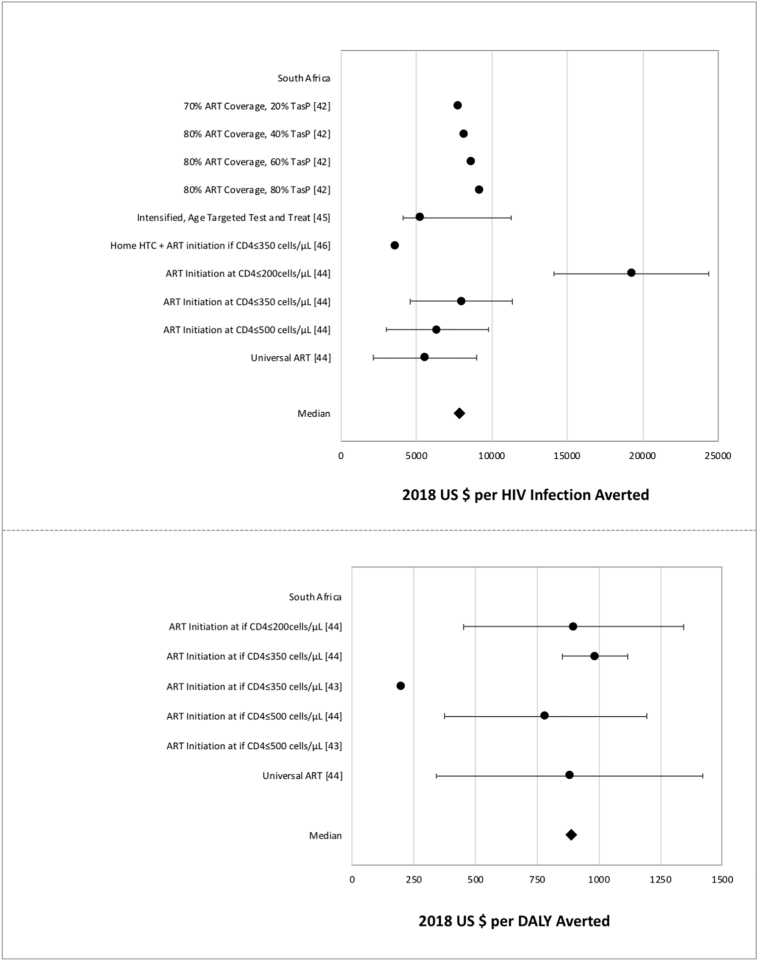
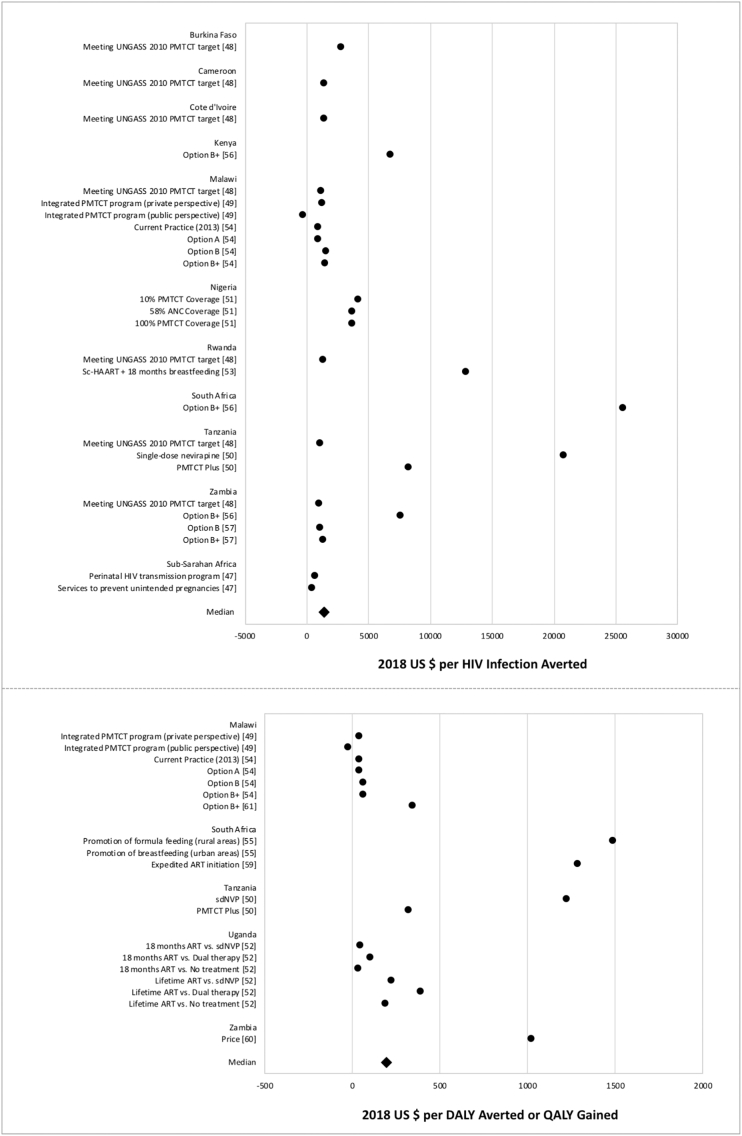
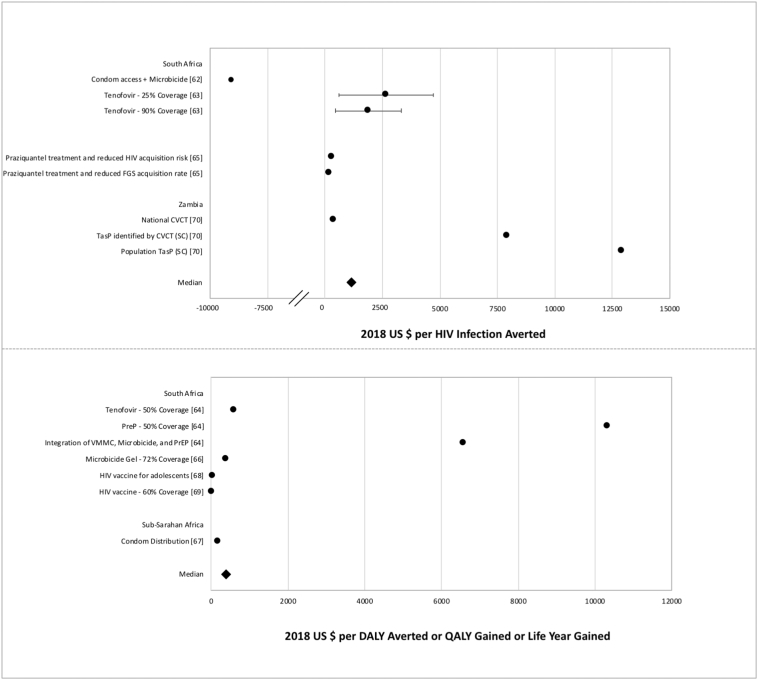
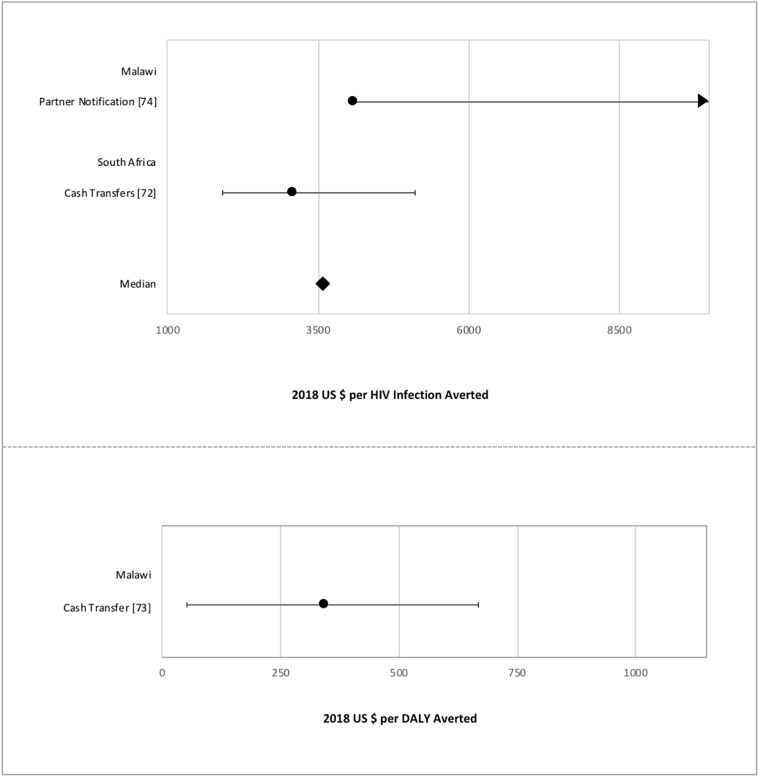
Findings: 60 studies met the full inclusion criteria. Prevention of mother-to-child transmission interventions had the lowest median CERs ($1144/HIV infection averted and $191/DALY averted), while pre-exposure prophylaxis interventions had the highest ($13,267/HIA and $799/DALY averted). Structural interventions (partner notification, cash transfer programs) have similar CERs ($3576/HIA and $392/DALY averted) to male circumcision ($2965/HIA) and were more favourable to treatment-as-prevention interventions ($7903/HIA and $890/DALY averted). Most interventions showed increased cost-effectiveness when prioritizing specific target groups based on age and risk.

Interpretation: The presented cost-effectiveness information can aid policy makers and other stakeholders as they develop guidelines and programming for HIV prevention plans in resource-constrained settings.


Figures

Fig. 1
Fig. 1
Flowchart diagram for study selection.
Fig. 2
Fig. 2
Cost-effectiveness measures of VMMC interventions. Data points reflect the measures from VMMC studies reporting cost per HIV infection averted (above) and cost per DALY averted (below). Points represent study-specific cost-effectiveness estimates; error bars represent estimate ranges, if provided in study results.
Fig. 3
Fig. 3
Cost-effectiveness measures of PrEP interventions. Data points reflect the measures from PrEP studies reporting cost per HIV infection averted (above) and cost per DALY averted or QALY gained (below). Points represent study-specific cost-effectiveness estimates; error bars represent estimate ranges, if provided in study results.
Fig. 4
Fig. 4
Cost-effectiveness measures of TasP interventions. Data points reflect the measures from TasP studies reporting cost per HIV infection averted (above) and cost per DALY averted (below). Points represent study-specific cost-effectiveness estimates; error bars represent estimate ranges, if provided in study results.
Fig. 5
Fig. 5
Cost-effectiveness measures of PMTCT interventions. Data points reflect the measures from PMTCT studies reporting cost per HIV infection averted (above) and cost per DALY averted or QALY gained (below). Points represent study-specific cost-effectiveness estimates.
Fig. 6
Fig. 6
Cost-effectiveness measures of biomedical interventions. Data points reflect the measures from miscellaneous biomedical studies reporting cost per HIV infection averted (above) and cost per DALY averted or QALY gained (below). Points represent study-specific cost-effectiveness estimates; error bars represent estimate ranges, if provided in study results.
Fig. 7
Fig. 7
Cost-effectiveness measures of structural interventions. Data points reflect the measures from structural intervention studies reporting cost per HIV infection averted (above) and cost per DALY averted (below). Points represent study-specific cost-effectiveness estimates; error bars represent estimate ranges, if provided in study results.
Fig. 8
Fig. 8
Visual representation of CHEERS checklist evaluation. Green bars represent the number of studies that completely fulfilled the corresponding item of the CHEERS checklist. Blue bars represent the number of studies that did not fulfill an applicable item. Gray bars represent the number of studies that partially, but did not completely, fulfilled the CHEERS checklist item. Yellow bars represent number of studies for which the item was not applicable.

Similar articles

Cited by

References

    1. AIDSInfo UN joint programme on HIV/AIDS (UNAIDS). Trends of new HIV infections. http://aidsinfo.unaids.org/ Available from:
    1. Programmatic update - antiretroviral treatment as prevention (TASP) of HIV and TB. HIV/AIDS programme. World Health Organization; 2012.
    1. Prevention gap report: UN joint Programme on HIV/AIDS (UNAIDS) 2016.
    1. HIV Investments . 2016. UN joint Programme on HIV/AIDS (UNAIDS)
    1. Fast-track update on investments needed in the AIDS response: UN joint programme on HIV/AIDS (UNAIDS) 2016.

LinkOut - more resources