. 2018 Jul 20:5:100021.
doi: 10.1016/j.ynpai.2018.07.002. eCollection 2019 Jan-Jul.

Human-like cutaneous neuropathologies associated with a porcine model of peripheral neuritis: A translational platform for neuropathic pain

Affiliations

Human-like cutaneous neuropathologies associated with a porcine model of peripheral neuritis: A translational platform for neuropathic pain

Frank L Rice et al. Neurobiol Pain. .

Abstract

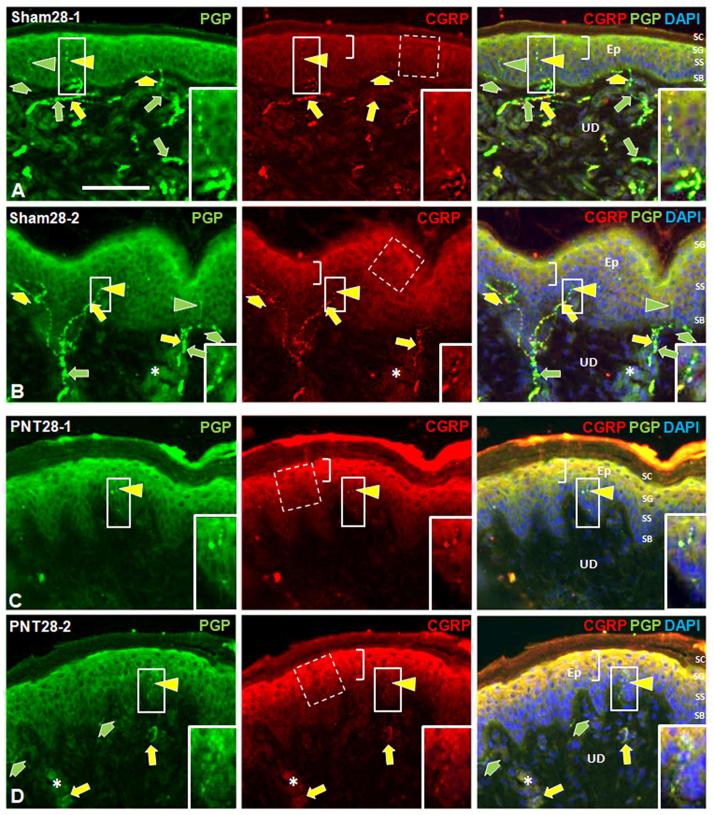
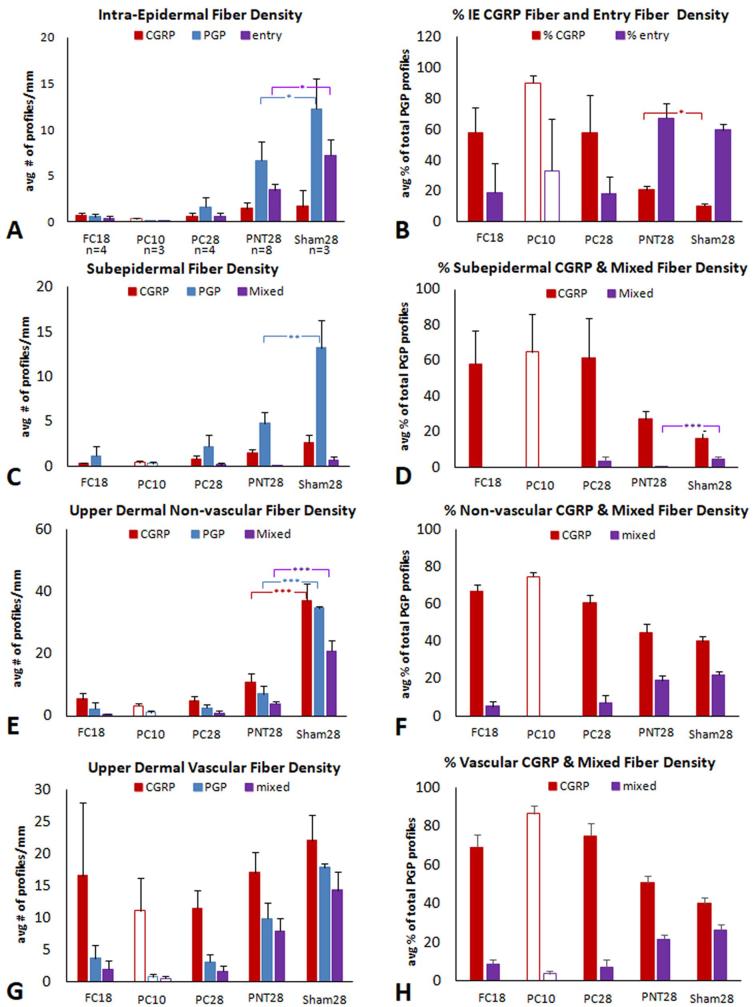
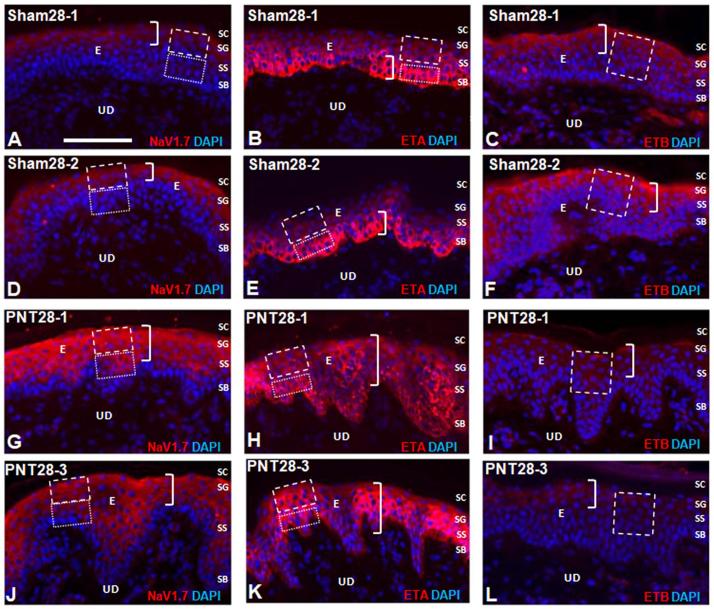
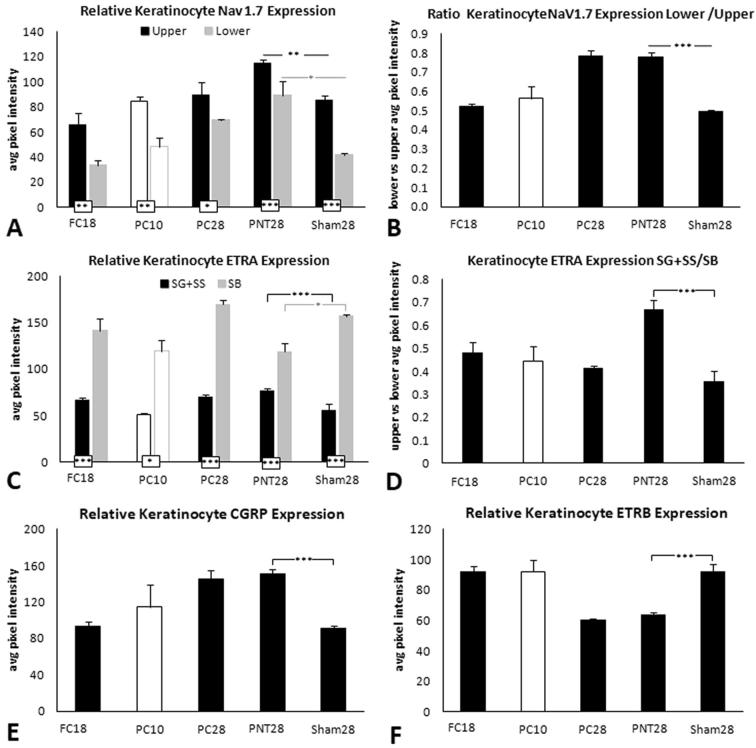
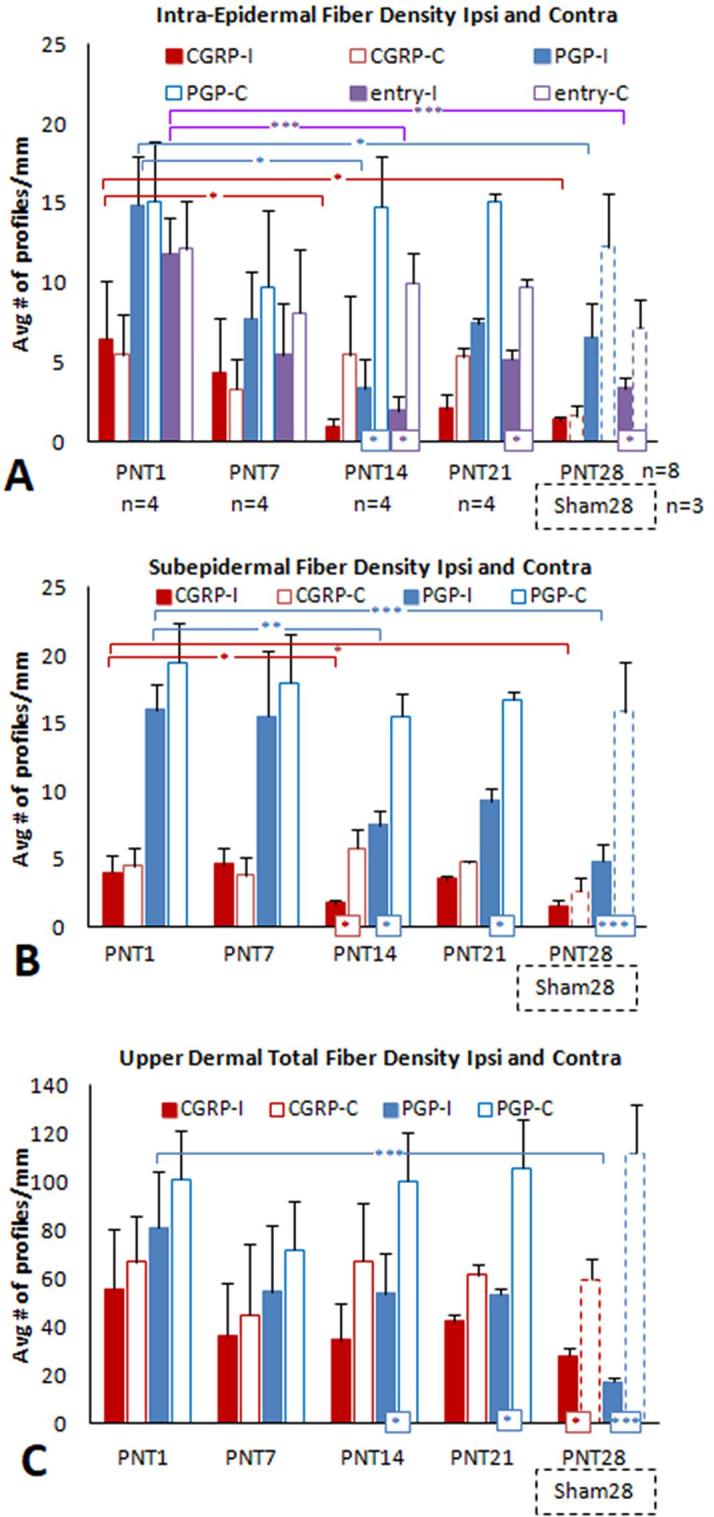
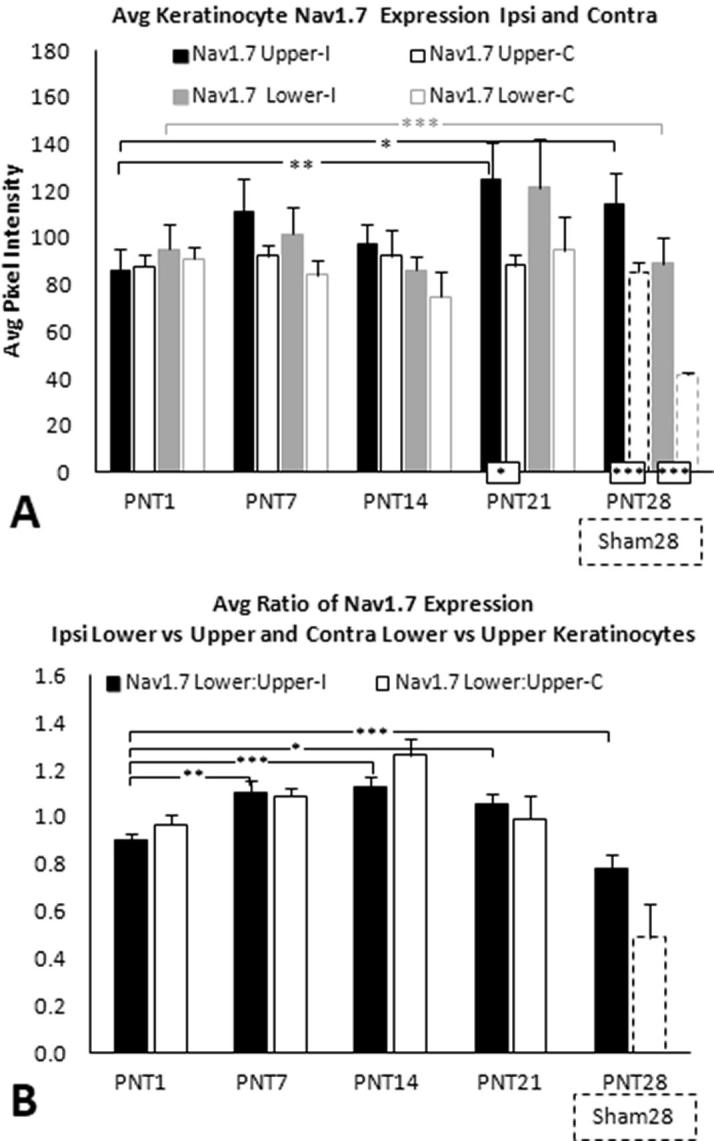
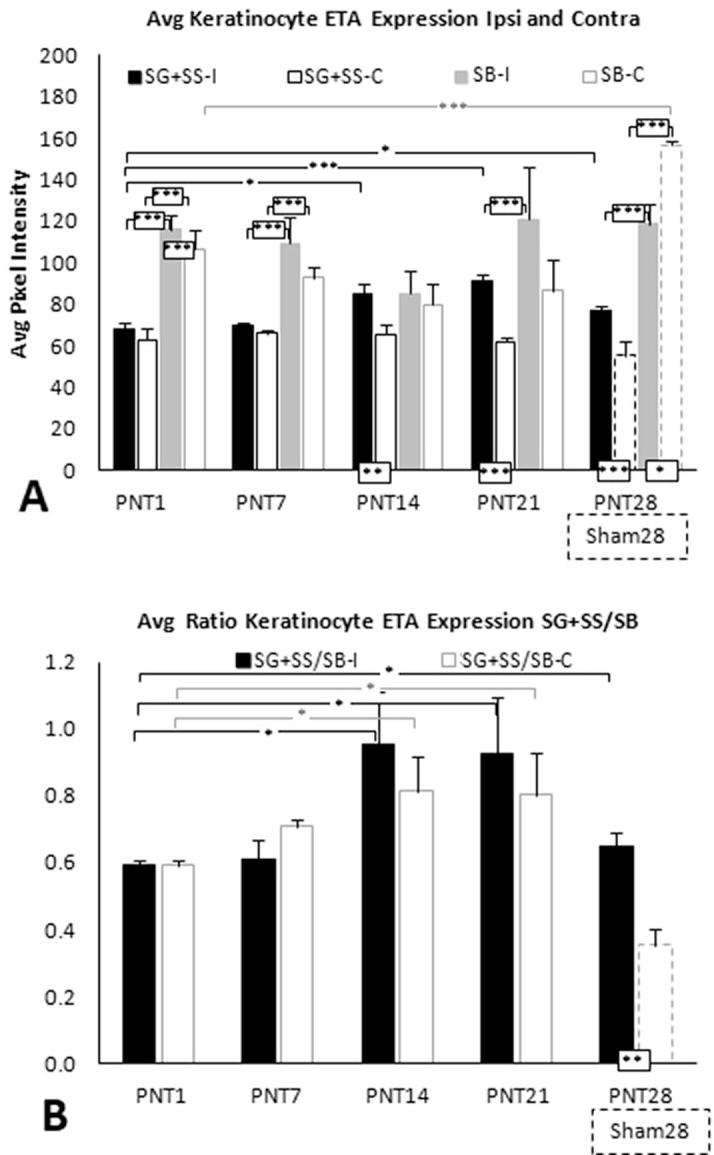
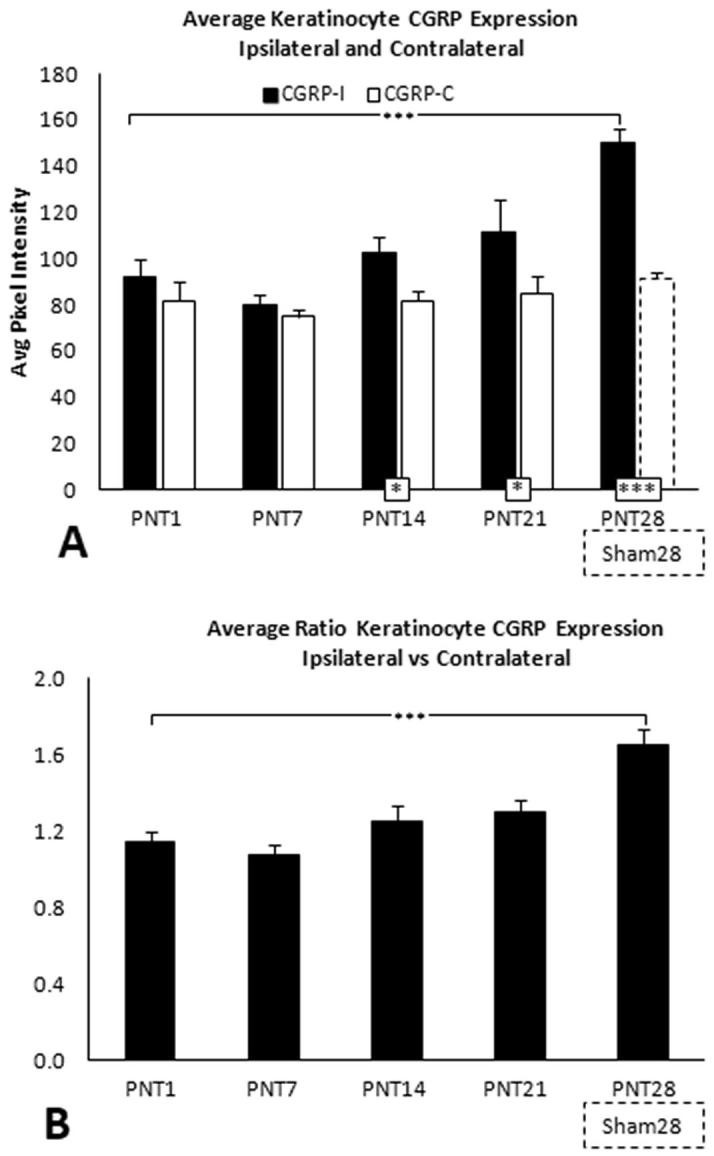
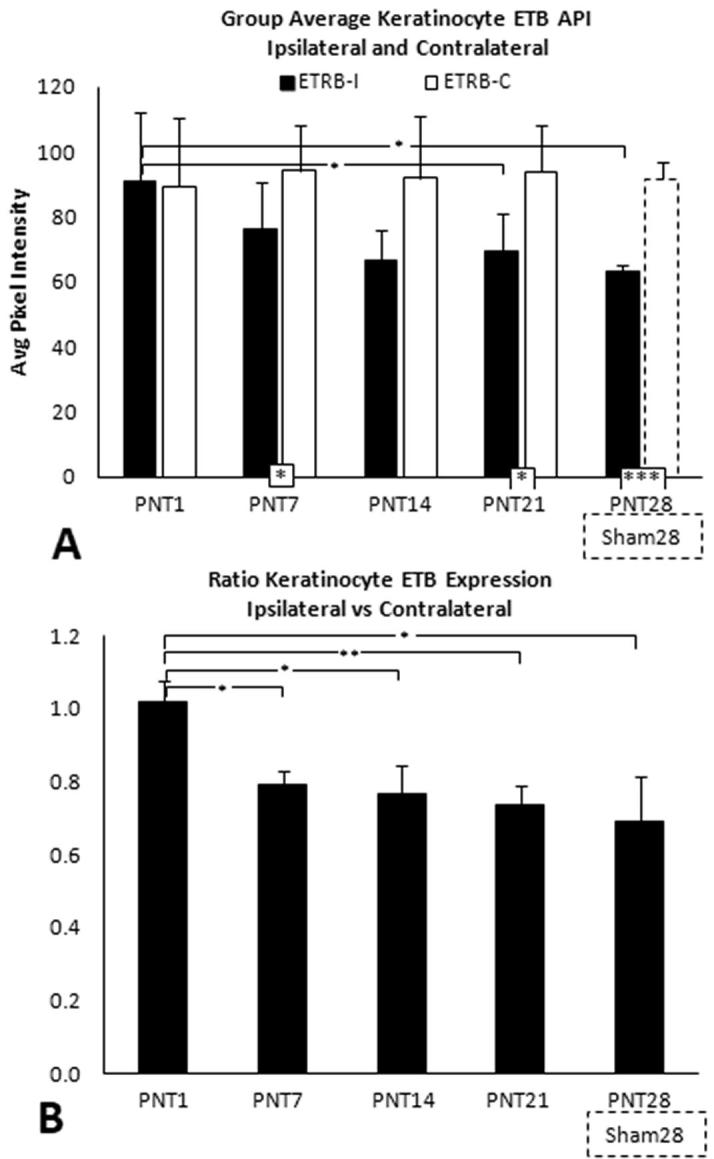
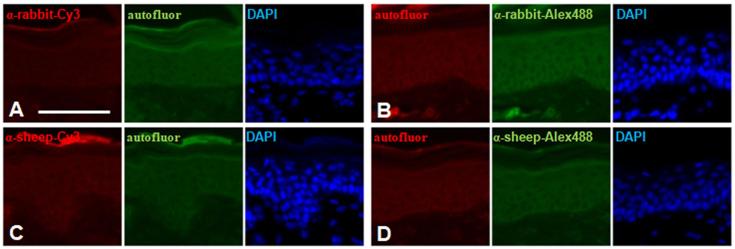
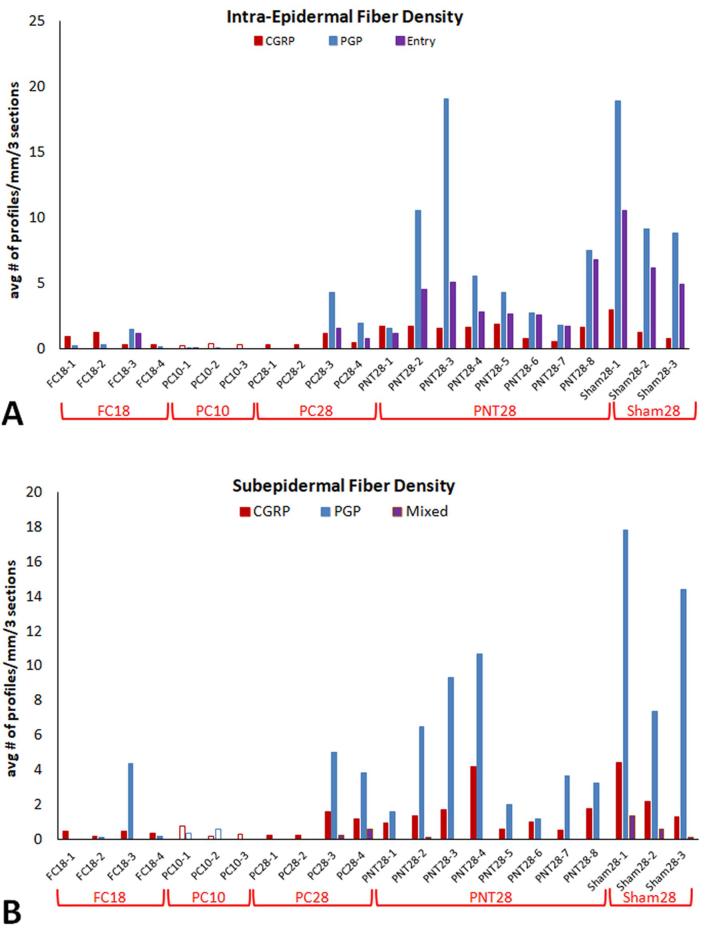
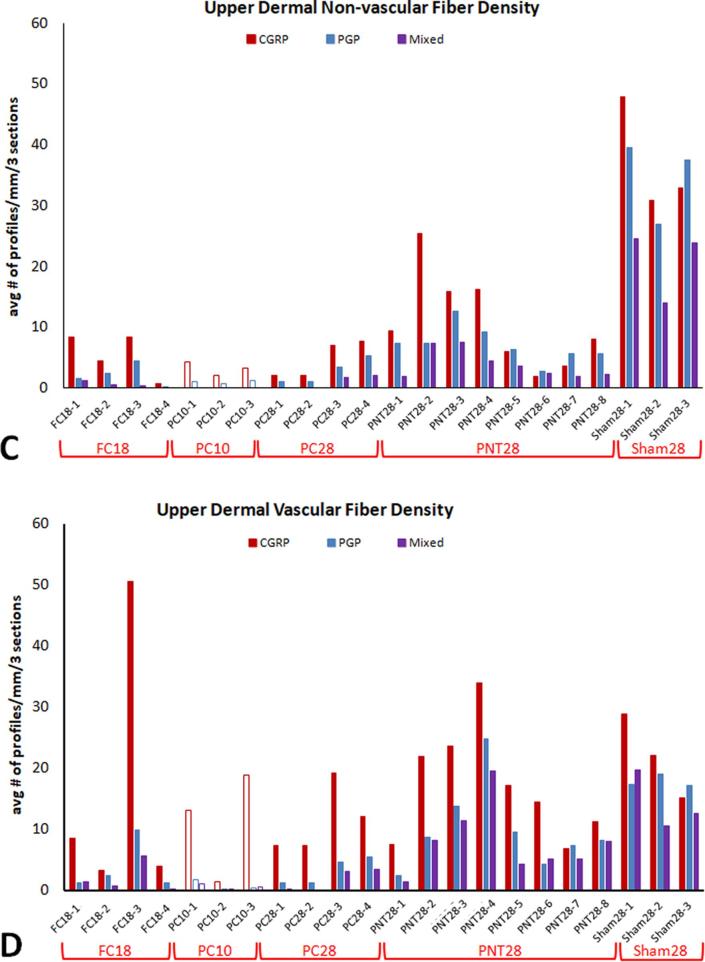
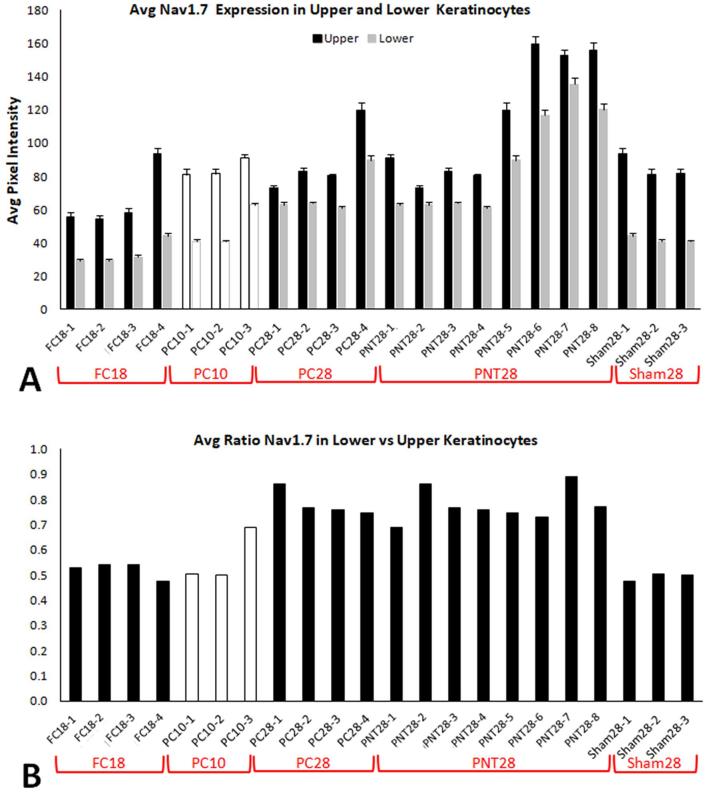
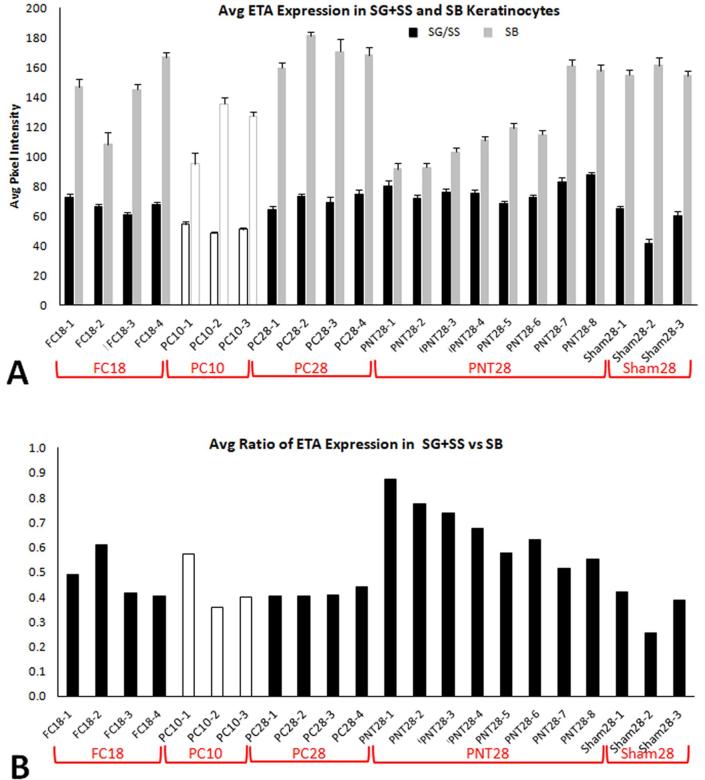
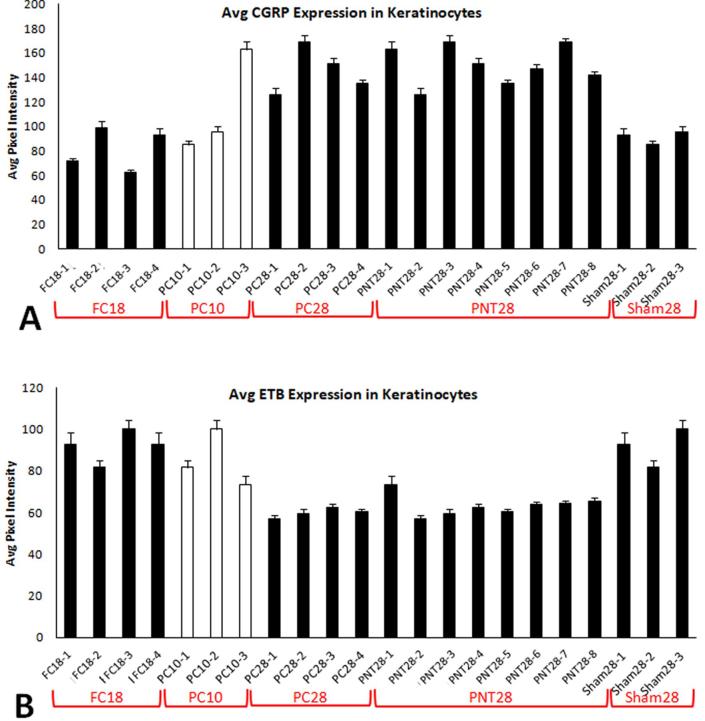
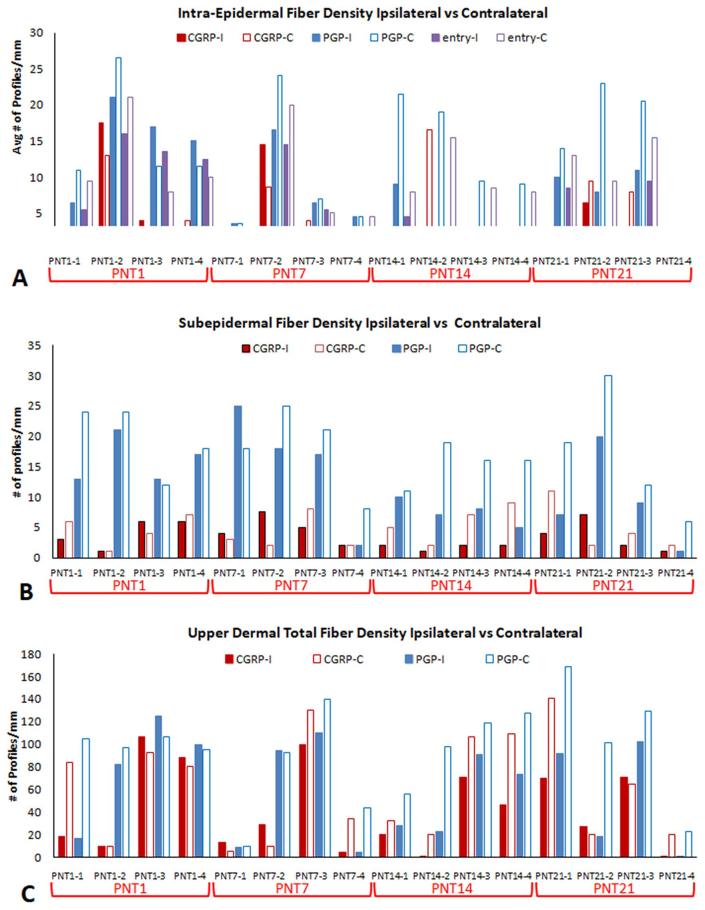
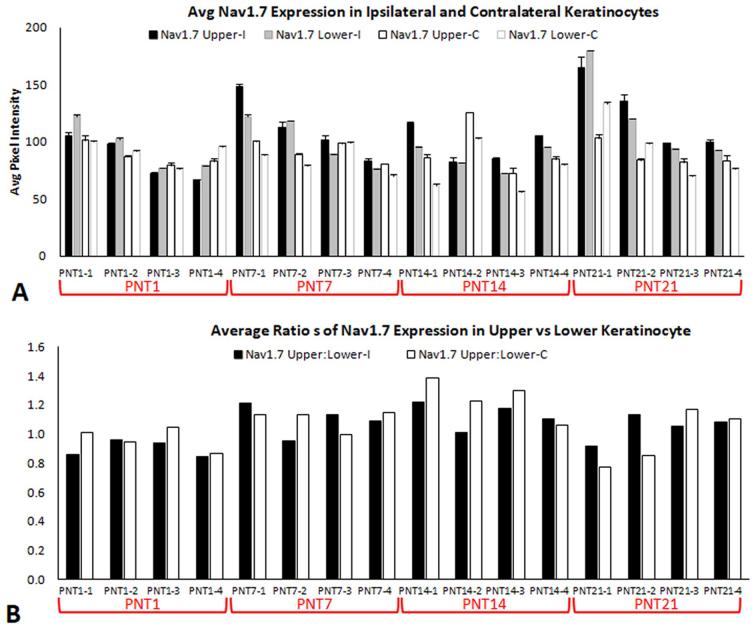
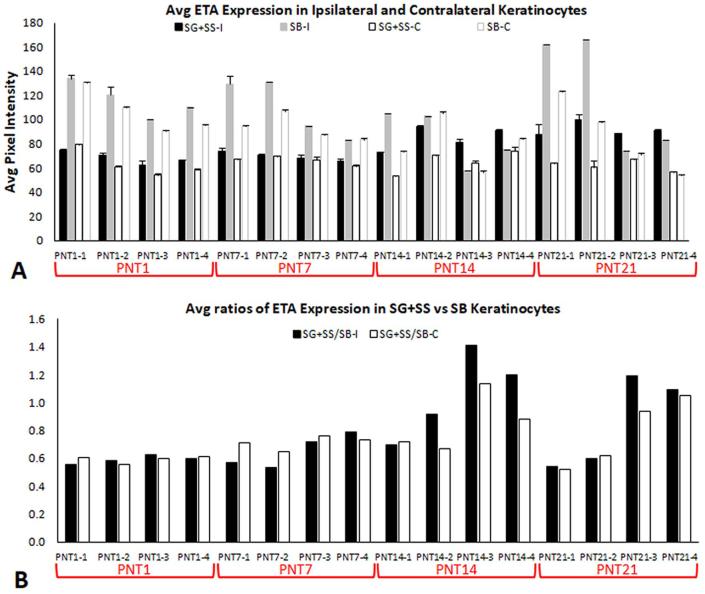
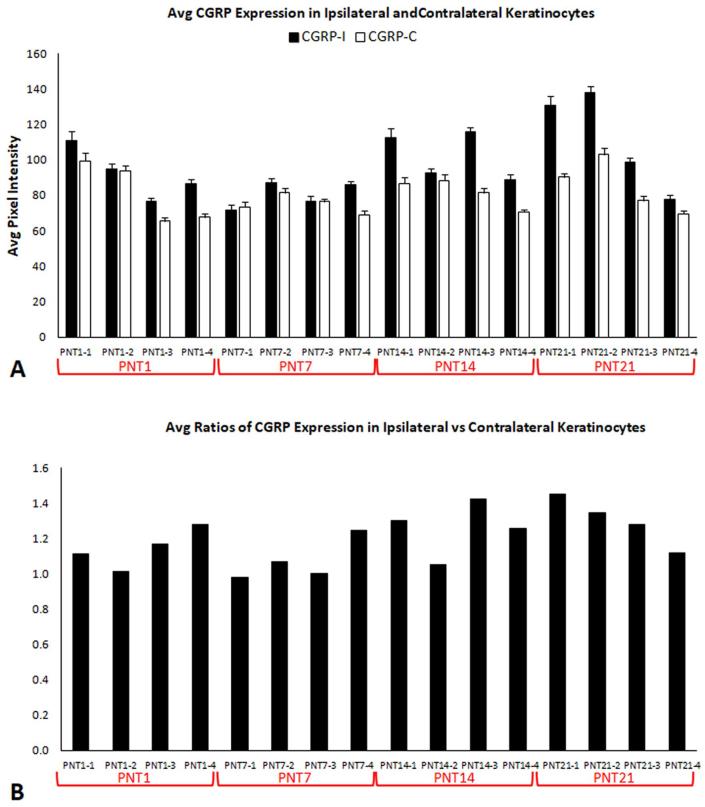
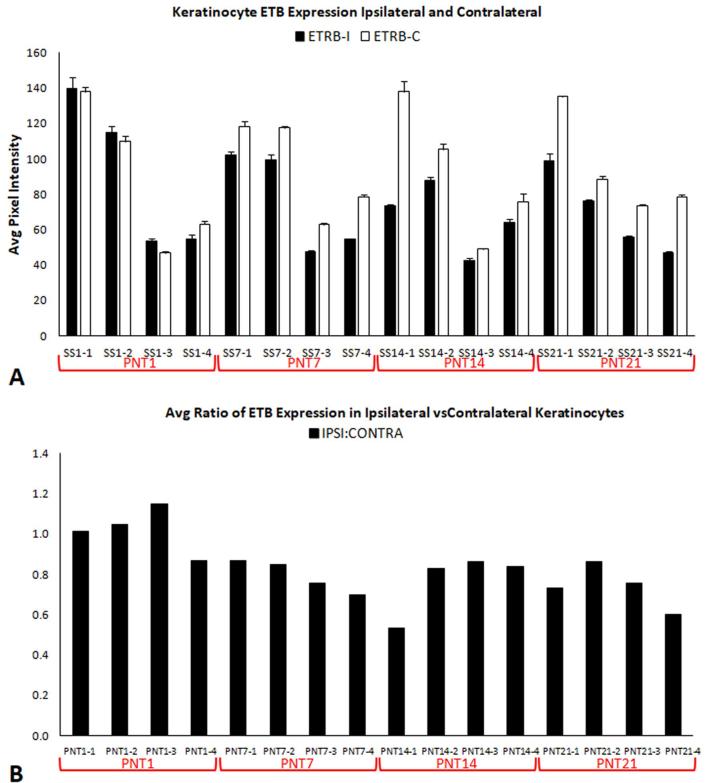
Despite enormous investment in research and development of novel treatments, there remains a lack of predictable, effective, and safe therapeutics for human chronic neuropathic pain (NP) afflictions. NP continues to increase among the population and treatments remain a major unmet public health care need. In recent years, numerous costly (time and money) failures have occurred attempting to translate successful animal pain model results, typically using rodents, to human clinical trials. These continued failures point to the essential need for better animal models of human pain conditions. To address this challenge, we have previously developed a peripheral neuritis trauma (PNT) model of chronic pain induced by a proximal sciatic nerve irritation in pigs, which have a body size, metabolism, skin structure, and cutaneous innervation more similar to humans. Here, we set out to determine the extent that the PNT model presents with cutaneous neuropathologies consistent with those associated with human chronic NP afflictions. Exactly as is performed in human skin biopsies, extensive quantitative multi-molecular immunofluorescence analyses of porcine skin biopsies were performed to assess cutaneous innervation and skin structure. ChemoMorphometric Analysis (CMA) results demonstrated a significant reduction in small caliber intraepidermal nerve fiber (IENF) innervation, altered dermal vascular innervation, and aberrant analgesic/algesic neurochemical properties among epidermal keratinocytes, which are implicated in modulating sensory innervation. These comprehensive pathologic changes very closely resemble those observed from CMA of human skin biopsies collected from NP afflictions. The results indicate that the porcine PNT model is more appropriate for translational NP research compared with commonly utilized rodent models. Because the PNT model creates cutaneous innervation and keratinocyte immunolabeling alterations consistent with human NP conditions, use of this animal model for NP testing and treatment response characteristics will likely provide more realistic results to direct successful translation to humans.

Keywords: Animal model; CGRP; ET-1 receptors; IENF density; Immunolabeling; NaV; PGP9.5.


Figures

Fig. 1
Fig. 1
Representative images of double immunolabeling for PGP (green fluorescence, left column) and CGRP (red fluorescence, middle column) in ipsilateral biopsies from the dorsal hind foot of two Sham28 (A, B) and two PNT28 pigs (C, D). Merged images with DAPI nuclear staining (blue fluorescence) are shown in the right column. E, epidermis; UD, upper dermis; SB, Stratum Basalis; SS, Stratum Spinosum; SG, Stratum Granulosum; SC, Stratum Corneum. Scale bar = 100 μm. Arrowheads indicate immunolabeled neural profiles in the epidermis which are sensory intraepidermal nerve fiber (IENF) endings. Inserts in the solid line rectangles are 2× enlargements of endings shown in the smaller solid line rectangles, which are shown at a brighter and higher contrast. Broad arrows indicate immunolabeled neural profiles in the subepidermis, immediately subjacent to the epidermal basement membrane, which are a mix of individual fibers or small nerves containing two or more axon fibers. Long arrows indicate immunolabeled neural profiles in the upper dermis which are a mix of individual fibers and two or more fibers within small nerves, some of which are affiliated with small upper dermal blood vessels, particularly observed by concentrated DAPI labeling of cells in the vessel walls (asterisks). Nonpeptidergic neural profiles only labeled for PGP (green arrowheads and arrows), and peptidergic neural profiles double-labeled for CGRP and PGP (yellow arrowheads and arrows). Innervation at all levels was depleted following PNT28 injury compared with Sham28 biopsies. Middle panel brackets indicate the epidermal keratinocyte strata labeled for CGRP, which was more intense following PNT28 injury compared with Sham28 biopsies. Broken line rectangles represent the size and location of the sampling marquee that was systematically applied to quantify average CGRP immunofluorescence PI. (For interpretation of the references to colour in this figure legend, the reader is referred to the web version of this article.)
Fig. 2
Fig. 2
Average density and ratio measures of neural profiles (bars and SEM) characterized as peptidergic and nonpeptidergic for ipsilateral FC18, PC10, PC28, PNT28, and Sham28 biopsies (see Table 1, Part 1). PC10 bars are unfilled since they involve a purposefully shorter post-operative biopsy collection. *p ≤ 0.05; **p ≤ 0.01; ***p ≤ 0.005. (A, B) IENF density. (A) Red bars are the average peptidergic fiber density defined as profiles within the epidermis that co-label for CGRP and PGP. Blue bars are the average nonpeptidergic fiber density that only label for PGP. Purple bars are the average density of both types that have a discernible entry into the epidermis defined as a contact with or passage through the epidermal basement membrane. (B) Red bars are the average percentage of the total profiles that are peptidergic. Purple bars are average percentage of the total profiles that have an entry point. (C, E, G) Red bars are the average peptidergic fiber density defined as profiles that only co-label for CGRP and PGP. Blue bars are the average nonpeptidergic fiber density that only label for PGP. Purple bars are those profiles that can contain at least one peptidergic and one nonpeptidergic axon. (D, F, H) Red bars are the average percentage of the total profiles that are peptidergic. Purple bars are average percentage of the total profiles that have an entry point. (C, D) Subepidermal fiber density and ratio measures. (E, F) Upper dermal non-vascular fiber density and ratio measures. (G, H) Upper dermal vascular fiber density and ratio measures. (For interpretation of the references to colour in this figure legend, the reader is referred to the web version of this article.)
Fig. 3
Fig. 3
Representative images of Cy3 immunofluorescent labeling (red) for Nav1.7 (left column), ETA (middle column), and ETB (right column) in two Sham28 (A–F) and two PNT28 (G–L) ipsilateral biopsies. Cell nuclei are counterstained with DAPI (blue fluorescence). E, epidermis; UD, upper dermis; SB, Stratum Basalis; SS, Stratum Spinosum; SG, Stratum Granulosum; SC, Stratum Corneum. Scale bar = 100 μm. A,D,G,J. Nav1.7 immunolableing in Sham28 biopsies was concentrated in SG and upper SS (brackets in A, D) and increased in intensity as well as expanding through the full depth of SS, encroaching on SB in PNT28 biopsies (brackets in G, J). Quantification was based on repeated sampling of average PI in the upper and lower keratinocytes demarcated by the broken and dotted line marquees, respectively. (B, E, H, K) ETA expression in Sham28 biopsies was concentrated in SB (brackets in B, E) and expanded through the full depth of SG and SS in PNT28 biopsies (brackets in H, K). Quantification was based on repeated sampling of average pixel intensities in the SG and SS and in SB demarcated by the broken and dotted line marquees, respectively. (C, F, I, L) ETB expression in Sham28 biopsies was concentrated in SG and upper SS (brackets in C, F) and diminished in PNT28 biopsies (brackets in I, L). Quantification was based on repeated sampling of average pixel intensities in the SG and SS demarcated by the broken line marquees. (For interpretation of the references to colour in this figure legend, the reader is referred to the web version of this article.)
Fig. 4
Fig. 4
Keratinocyte average immunofluorescent pixel intensity (PI) from FC18, PC10, PC28, PNT28, and Sham28 for Nav1.7 (A), ETA (C), CGRP (E), and ETB (F). *p ≤ 0.05; **p ≤ 0.01; ***p ≤ 0.005. (B) Ratio of lower to upper average PI for Nav1.7 (black and gray bars respectively). (D) Ratio of combined SG and SS to SB average PI for ETA (black and gray bars respectively).
Fig. 5
Fig. 5
Average density of neural profiles characterized as peptidergic and nonpeptidergic from ipsilateral and contralateral PNT1, PNT7, PNT14 and PNT21 biopsies (see Table 1, Part 2). Results from ipsilateral PNT28 and Sham28 (broken line bars) biopsies are included from Fig. 2A. *p ≤ 0.05; **p ≤ 0.01; ***p ≤ 0.005. (A) IENF density. Red bars are the average peptidergic fiber density defined as profiles within the epidermis that co-label for CGRP and PGP. Blue bars are the average nonpeptidergic fiber density as profiles that only label for PGP. Purple bars are the average density of both types that have a discernible entry into the epidermis defined as a contact with or passage through the epidermal basement membrane. (B, C) Subepidermal fiber density (B) and upper dermal total vascular and non-vascular fiber density (C). Red bars are the average peptidergic fiber density defined as profiles that only co-label for CGRP and PGP. Blue bars are the average nonpeptidergic fiber density as profiles that only label for PGP. Purple bars are those profiles that can contain at least one peptidergic and one nonpeptidergic axon. (For interpretation of the references to colour in this figure legend, the reader is referred to the web version of this article.)
Fig. 6
Fig. 6
(A) Average keratinocyte Nav1.7 PI among upper and lower keratinocytes for ipsilateral biopsies (solid black and gray bars, respectively) and contralateral biopsies (open black and gray bars, respectively) from PNT1, PNT7, PNT14, and PNT 21 pigs (see Table 1, Part 2). (B) Ratios of lower divided by upper average keratinocyte Nav1.7 PI for ipsilateral and contralateral biopsies (solid and open bars, respectively). (A) and (B) show results from average ipsilateral Nav1.7 PI among upper and lower epidermal keratinocytes in PNT28 biopsies (solid black and gray bars, respectively) and ipsilateral Sham28 biopsies (open broken line black and gray bars, respectively), included from Fig. 4A and B.
Fig. 7
Fig. 7
(A) Average keratinocyte ETA PI among SG and SS and among SB keratinocytes for ipsilateral biopsies (solid black and gray bars, respectively) and contralateral biopsies (open black and gray bars, respectively) from PNT1, PNT7, PNT14, and PNT 21 pigs (see Table 1, Part 2). (B) Ratios of SG and SS divided by SB average keratinocyte ETA PI for ipsilateral and contralateral biopsies (solid and open bars, respectively). (A) and (B) show results from average ipsilateral ETA PI in SG and SS and in SB epidermal keratinocytes in PNT28 biopsies (solid black and gray bars, respectively) and ipsilateral Sham28 biopsies (open broken line black and gray bars, respectively), included from Fig. 4C and D.
Fig. 8
Fig. 8
(A) Average keratinocyte CGRP PI for ipsilateral and contralateral biopsies (solid and open bars, respectively) from PNT1, PNT7, PNT14, and PNT 21 pigs (see Table 1, Part 2). (B) Ratios of ipsilateral divided by contralateral average CGRP PI. (A) and (B) show results for ipsilateral PNT28 biopsies and Sham28 biopsies (broken lines), included from Fig. 4E.
Fig. 9
Fig. 9
(A) Average keratinocyte ETB PI for ipsilateral and contralateral biopsies (solid and open bars, respectively) from PNT1, PNT7, PNT14, and PNT 21 pigs (see Table 1, Part 2). (B) Ratios of ipsilateral divided by contralateral average ETB PI. (A) and (B) show results for ipsilateral PNT28 biopsies and Sham28 biopsies (broken lines), included from Fig. 4F.
Supplementary Fig. S1
Separate channel images of the epidermal and upper dermal labeling only with donkey anti-rabbit (A, B) and donkey anti-sheep (C, D) secondary antibodies, omitting primary andtibodies and counter-labeling with DAPI (blue channel). (A, C) Secondary antibodies conjugated with Cy3 (red channel) combined with autofluorescence in the green channel. (B, D) Secondary antibodies conjugated with Alexa 488 (green channel) combined with autofluorescence in the red channel.
Supplementary Fig. S2
Average density of neural profiles (bars and SEM) characterized as peptidergic and nonpeptidergic for each ipsilateral FC18, PC10, PC28, PNT28, and Sham28 biopsy (see Table 1, Part 1). PC10 bars are unfilled since they involve a purposefully shorter post-operative time. (A) IENF density. Red bars are the average peptidergic fiber density defined as profiles within the epidermis that co-label for CGRP and PGP. Blue bars are the average nonpeptidergic fiber density as profiles that only label for PGP. Purple bars are the average density of both types that have a discernible entry into the epidermis defined as a contact with or passage through the epidermal basement membrane. (B–D) Subepidermal (B), upper dermal non-vascular (C), and upper dermal vascular (D). Red bars are the average peptidergic fiber density defined as profiles that only co-label for CGRP and PGP. Blue bars are the average nonpeptidergic fiber density as profiles that only label for PGP. Purple bars are those profiles that can contain at least one peptidergic and one nonpeptidergic axon.
Supplementary Fig. S3
(A) Average keratinocyte Nav1.7 fluorescent pixel intensities (PI) in ipsilateral biopsies among upper and lower keratinocytes (black and gray bars respectively) for each FC18, PC10, PC28, PNT28, and Sham28 pig. (B) Ratio of lower divided by upper average Nav1.7 keratinocyte PI for each pig.
Supplementary Fig. S4
(A) Average keratinocyte ETA fluorescent PI in ipsilateral biopsies among SG and SS, and SB keratinocytes (black and gray bars respectively) for each FC18, PC10, PC28, PNT28, and Sham28 pig. (B) Ratio of SG and SS divided by SB average Nav1.7 keratinocyte PI for each pig.
Supplementary Fig. S5
(A) Average keratinocyte CGRP fluorescent PI in ipsilateral biopsies from each FC18, PC10, PC28, PNT28, and Sham28 pig. (B) Average keratinocyte ETB fluorescent PI in ipsilateral biopsies from each pig.
Supplementary Fig. S6
Average density of neural profiles (bars and SEM) characterized as peptidergic and nonpeptidergic for each ipsilateral (solid bars) and contralateral biopsy (open bars) from each PNT1, PNT7, PNT14, and PNT21 pig (see Table 1, Part 2). (A) IENF density. Red bars are the average peptidergic fiber density defined as profiles within the epidermis that co-label for CGRP and PGP. Blue bars are the average nonpeptidergic fiber density as profiles that only label for PGP. Purple bars are the average density of both types that have a discernible entry into the epidermis defined as a contact with or passage through the epidermal basement membrane. (B, C) Subepidermal (B) and total upper dermal. Red bars are the average peptidergic fiber density defined as profiles that only co-label for CGRP and PGP. Blue bars are the average nonpeptidergic fiber density as profiles that only label for PGP. Purple bars are those profiles that can contain at least one peptidergic and one nonpeptidergic axon.
Supplementary Fig. S7
(A) Average Nav1.7 fluorescent PI among upper and lower keratinocytes in ipsilateral (solid black and gray bars, respectively) and contralateral biopsies (open black and gray bars, respectively) from each PNT1, PNT7, PNT14, and PNT 21 pig (see Table 1, Part 2). (B) Ratios of lower divided by upper average keratinocyte Nav1.7 PI in ipsilateral and contralateral biopsies (solid and open bars, respectively).
Supplementary Fig. S8
(A) Average ETA fluorescent PI among SG and SS and among SB keratinocytes in ipsilateral (solid black and gray bars, respectively) and contralateral biopsies (open black and gray bars, respectively) from each PNT1, PNT7, PNT14, and PNT 21 pig. (see Table 1, Part 2). (B) Ratios of SG and SS divided by SB average keratinocyte ETA PI in ipsilateral and contralateral biopsies (solid and open bars, respectively).
Supplementary Fig. S9
(A) Average keratinocyte CGRP fluorescent PI in ipsilateral and contralateral biopsies (solid and open bars, respectively) from each PNT1, PNT7, PNT14, and PNT21 pig (see Table 1, Part 2). (B) Ratios of ipsilateral divided by contralateral average CGRP PI.
Supplementary Fig. S10
(A) Average keratinocyte ETB fluorescent PI in ipsilateral and contralateral biopsies (solid and open bars, respectively) from each PNT1, PNT7, PNT14, and PNT21 pig (see Table 1, Part 2). (B) Ratios of ipsilateral divided by contralateral average ETB PI.

Similar articles

Cited by

References

    1. Albrecht P.J., Hines S., Eisenberg E., Pud D., Finlay D.R., Connolly M.K., Pare M., Davar G., Rice F.L. Pathologic alterations of cutaneous innervation and vasculature in affected limbs from patients with complex regional pain syndrome. Pain. 2006;120(3):244–266. - PubMed
    1. Albrecht P.J., Hou Q., Argoff C.E., Storey J.R., Wymer J.P., Rice F.L. Excessive peptidergic sensory innervation of cutaneous arteriole-venule shunts (Avs) in the palmar glabrous skin of fibromyalgia patients: implications for widespread deep tissue pain and fatigue. Pain Med. 2013;14(6):895–915. - PubMed
    1. Albrecht, P.J., Houk, G., Ruggiero, E., Dockum, M., Czerwinski, M., Argoff, C., Wymer, J., Rice, F.L., 2018. Increased keratinocyte Nav1.6 subunit expression among painful diabetic peripheral neuropathy patients predicts topical lidocaine responsiveness (Submitted for publication). - PMC - PubMed
    1. Albrecht P.J., Rice F.L. Role of small-fiber afferents in pain mechanisms with implications on diagnosis and treatment. Curr. Pain Headache Rep. 2010;14(3):179–188. - PubMed
    1. Bagnato A., Venuti A., Di Castro V., Marcante M.L. Identification of the eta receptor subtype that mediates endothelin induced autocrine proliferation of normal human keratinocytes. Biochem. Biophys. Res. Commun. 1995;209(1):80–86. - PubMed