

Dual effects of brain sparing opioid in newborn rats: Analgesia and hyperalgesia
- PMID: 31194154
- PMCID: PMC6550121
- DOI: 10.1016/j.ynpai.2018.01.001
Dual effects of brain sparing opioid in newborn rats: Analgesia and hyperalgesia
Abstract
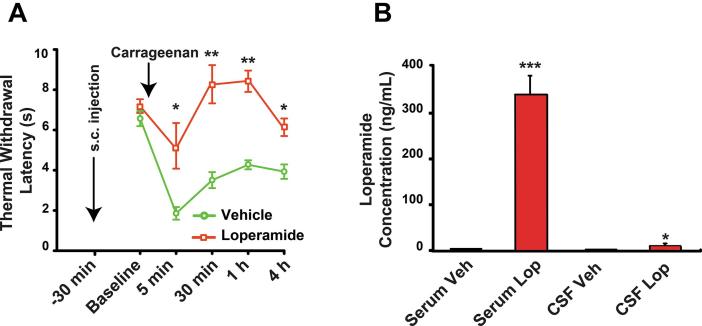
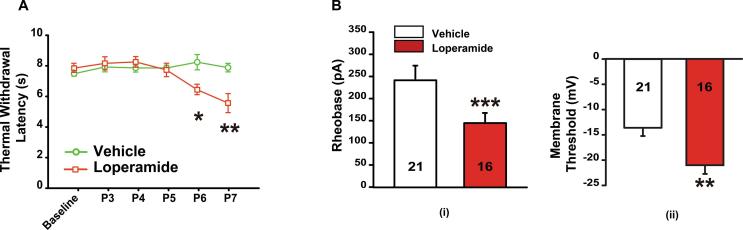
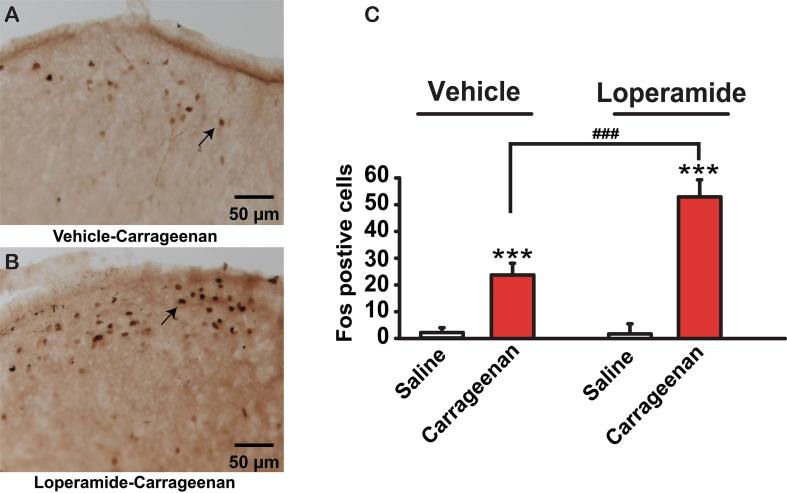
Effective pain management in neonates without the unwanted central nervous system (CNS) side effects remains an unmet need. To circumvent these central effects we tested the peripherally acting (brain sparing) opioid agonist loperamide in neonate rats. Our results show that: 1) loperamide (1 mg/kg, s.c.) does not affect the thermal withdrawal latency in the normal hind paw while producing antinociception in all pups with an inflamed hind paw. 2) A dose of loperamide 5 times higher resulted in only 6.9 ng/mL of loperamide in the cerebrospinal fluid (CSF), confirming that loperamide minimally crosses the blood-brain barrier (BBB). 3) Unexpectedly, sustained administration of loperamide for 5 days resulted in a hyperalgesic behavior, as well as increased excitability (sensitization) of dorsal root ganglia (DRGs) and spinal nociceptive neurons. This indicates that opioid induced hyperalgesia (OIH) can be induced through the peripheral nervous system. Unless prevented, OIH could in itself be a limiting factor in the use of brain sparing opioids in the neonate.
Keywords: Blood-brain barrier; Loperamide; Neonatal; Opiate induced hyperalgesia; Peripheral analgesia.
Figures
Similar articles
-
Characterization of the antihyperalgesic action of a novel peripheral mu-opioid receptor agonist--loperamide.Anesthesiology. 1999 Jan;90(1):225-34. doi: 10.1097/00000542-199901000-00029. Anesthesiology. 1999. PMID: 9915332
-
Combination of a δ-opioid Receptor Agonist and Loperamide Produces Peripherally-mediated Analgesic Synergy in Mice.Anesthesiology. 2019 Sep;131(3):649-663. doi: 10.1097/ALN.0000000000002840. Anesthesiology. 2019. PMID: 31343460 Free PMC article.
-
Loperamide (ADL 2-1294), an opioid antihyperalgesic agent with peripheral selectivity.J Pharmacol Exp Ther. 1999 Apr;289(1):494-502. J Pharmacol Exp Ther. 1999. PMID: 10087042
-
A comprehensive review of opioid-induced hyperalgesia.Pain Physician. 2011 Mar-Apr;14(2):145-61. Pain Physician. 2011. PMID: 21412369 Review.
-
Peripherally-acting opioids.Pain Physician. 2008 Mar;11(2 Suppl):S121-32. Pain Physician. 2008. PMID: 18443636 Review.
Cited by
-
Effectiveness of two extended-release buprenorphine formulations during postoperative period in neonatal rats.PLoS One. 2022 Oct 17;17(10):e0276327. doi: 10.1371/journal.pone.0276327. eCollection 2022. PLoS One. 2022. PMID: 36251720 Free PMC article.
-
Future Newborns with Opioid-Induced Neonatal Abstinence Syndrome (NAS) Could Be Assessed with the Genetic Addiction Risk Severity (GARS) Test and Potentially Treated Using Precision Amino-Acid Enkephalinase Inhibition Therapy (KB220) as a Frontline Modality Instead of Potent Opioids.J Pers Med. 2022 Dec 6;12(12):2015. doi: 10.3390/jpm12122015. J Pers Med. 2022. PMID: 36556236 Free PMC article. Review.
References
-
- Beland B., Fitzgerald M. Mu- and delta-opioid receptors are downregulated in the largest diameter primary sensory neurons during postnatal development in rats. Pain. 2001;90:143–150. - PubMed
-
- Beltran-Campos V., Silva-Vera M., Garcia-Campos M.L., Diaz-Cintra S. Effects of morphine on brain plasticity. Neurologia. 2015;30:176–180. - PubMed
LinkOut - more resources
Full Text Sources
Other Literature Sources
