

Determination of the metabolic index using the fluorescence lifetime of free and bound nicotinamide adenine dinucleotide using the phasor approach
- PMID: 31194290
- PMCID: PMC6842045
- DOI: 10.1002/jbio.201900156
Determination of the metabolic index using the fluorescence lifetime of free and bound nicotinamide adenine dinucleotide using the phasor approach
Abstract
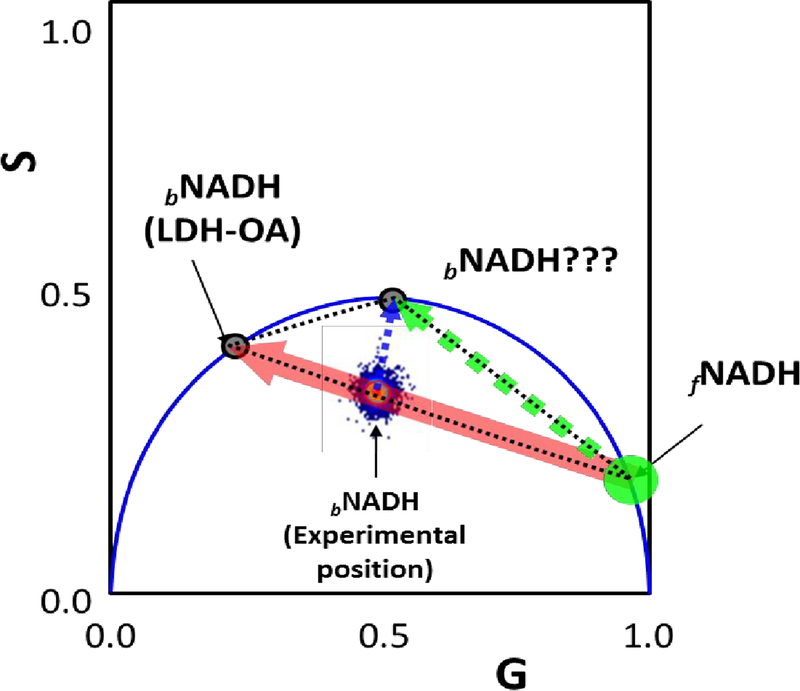
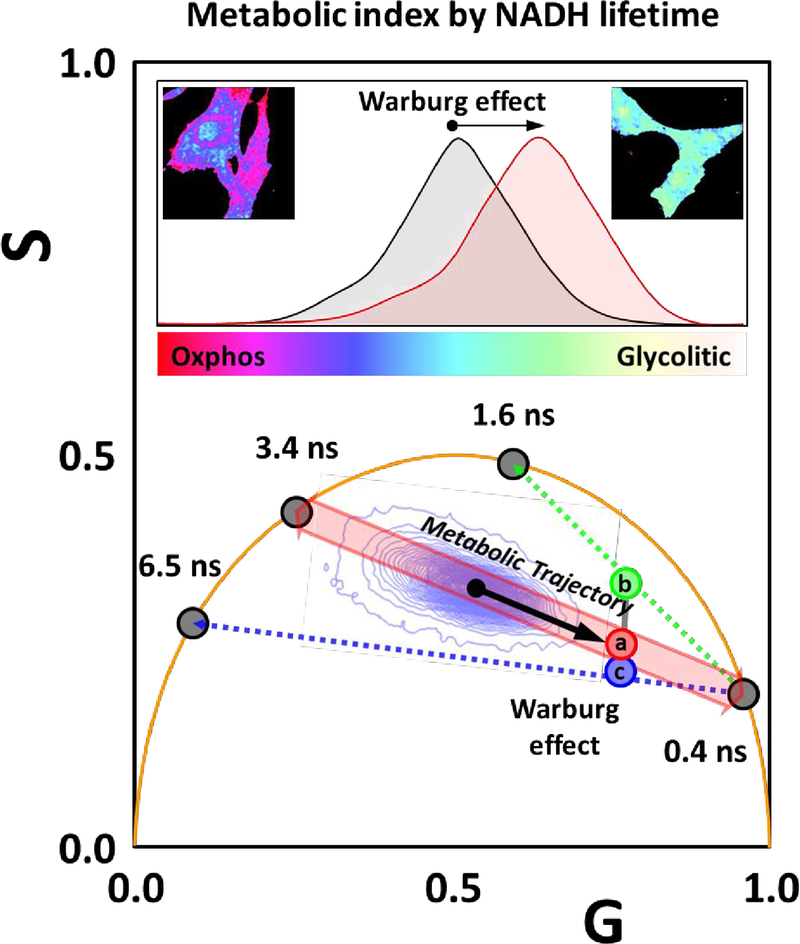
The fluorescence lifetime of nicotinamide adenine dinucleotide (NADH) is commonly used in conjunction with the phasor approach as a molecular biomarker to provide information on cellular metabolism of autofluorescence imaging of cells and tissue. However, in the phasor approach, the bound and free lifetime defining the phasor metabolic trajectory is a subject of debate. The fluorescence lifetime of NADH increases when bound to an enzyme, in contrast to the short multiexponential lifetime displayed by NADH in solution. The extent of fluorescence lifetime increase depends on the enzyme to which NADH is bound. With proper preparation of lactate dehydrogenase (LDH) using oxalic acid (OA) as an allosteric factor, bound NADH to LDH has a lifetime of 3.4 ns and is positioned on the universal semicircle of the phasor plot, inferring a monoexponential lifetime for this species. Surprisingly, measurements in the cellular environments with different metabolic states show a linear trajectory between free NADH at about 0.37 ns and bound NADH at 3.4 ns. These observations support that in a cellular environment, a 3.4 ns value could be used for bound NADH lifetime. The phasor analysis of many cell types shows a linear combination of fractional contributions of free and bound species NADH.
Keywords: FLIM; NADH; TCSPC; autofluorescence; lifetime; phasor.
© 2019 WILEY-VCH Verlag GmbH & Co. KGaA, Weinheim.
Conflict of interest statement
CONFLICT OF INTEREST
None to declare
Figures
Similar articles
-
Development and characterization of phasor-based analysis for FLIM to evaluate the metabolic and epigenetic impact of HER2 inhibition on squamous cell carcinoma cultures.J Biomed Opt. 2021 Oct;26(10):106501. doi: 10.1117/1.JBO.26.10.106501. J Biomed Opt. 2021. PMID: 34628733 Free PMC article.
-
Spatial Characterization of Bioenergetics and Metabolism of Primordial to Preovulatory Follicles in Whole Ex Vivo Murine Ovary.Biol Reprod. 2016 Dec;95(6):129. doi: 10.1095/biolreprod.116.142141. Epub 2016 Sep 28. Biol Reprod. 2016. PMID: 27683265 Free PMC article.
-
Real-time analysis of metabolic activity within Lactobacillus acidophilus by phasor fluorescence lifetime imaging microscopy of NADH.Curr Microbiol. 2013 Apr;66(4):365-7. doi: 10.1007/s00284-012-0285-2. Epub 2012 Dec 12. Curr Microbiol. 2013. PMID: 23233088
-
The Phasor Plot: A Universal Circle to Advance Fluorescence Lifetime Analysis and Interpretation.Annu Rev Biophys. 2021 May 6;50:575-593. doi: 10.1146/annurev-biophys-062920-063631. Annu Rev Biophys. 2021. PMID: 33957055 Review.
-
Label-Free Optical Metabolic Imaging in Cells and Tissues.Annu Rev Biomed Eng. 2023 Jun 8;25:413-443. doi: 10.1146/annurev-bioeng-071516-044730. Epub 2023 Apr 27. Annu Rev Biomed Eng. 2023. PMID: 37104650 Free PMC article. Review.
Cited by
-
Analyzing Olfactory Neuron Precursors Non-Invasively Isolated through NADH FLIM as a Potential Tool to Study Oxidative Stress in Alzheimer's Disease.Int J Mol Sci. 2021 Jun 12;22(12):6311. doi: 10.3390/ijms22126311. Int J Mol Sci. 2021. PMID: 34204595 Free PMC article. Review.
-
Simultaneous Application of Methylene Blue and Chlorin e6 Photosensitizers: Investigation on a Cell Culture.Sovrem Tekhnologii Med. 2025;17(1):58-68. doi: 10.17691/stm2025.17.1.06. Epub 2025 Feb 28. Sovrem Tekhnologii Med. 2025. PMID: 40071078 Free PMC article.
-
Label-free fluorescence microscopy: revisiting the opportunities with autofluorescent molecules and harmonic generations as biosensors and biomarkers for quantitative biology.Biophys Rev. 2023 Jun 26;15(4):709-719. doi: 10.1007/s12551-023-01083-4. eCollection 2023 Aug. Biophys Rev. 2023. PMID: 37681086 Free PMC article. Review.
-
Pathogenic, glycolytic PD-1+ B cells accumulate in the hypoxic RA joint.JCI Insight. 2020 Nov 5;5(21):e139032. doi: 10.1172/jci.insight.139032. JCI Insight. 2020. PMID: 33148884 Free PMC article.
-
Mapping metabolism of liver tissue using two-photon FLIM.Biomed Opt Express. 2020 Jul 20;11(8):4458-4470. doi: 10.1364/BOE.398020. eCollection 2020 Aug 1. Biomed Opt Express. 2020. PMID: 32923056 Free PMC article.
References
-
- Mayevsky A & Chance B Oxidation-reduction states of NADH in vivo: From animals to clinical use. Mitochondrion 7, 330–339 (2007). - PubMed
-
- Chance B Mitochondrial NADH redox state, monitoring discovery and deployment in tissue. Methods Enzymol. 385, 361–370 (2004). - PubMed
-
- Kennedy BE et al. NAD+salvage pathway in cancer metabolism and therapy. Pharmacol. Res 114, 274–283 (2016). - PubMed
Publication types
MeSH terms
Substances
Grants and funding
LinkOut - more resources
Full Text Sources
Other Literature Sources
Miscellaneous
