. 2019 Jun 13;15(6):e1007117.
doi: 10.1371/journal.pcbi.1007117. eCollection 2019 Jun.

Development of a physiologically-based pharmacokinetic pediatric brain model for prediction of cerebrospinal fluid drug concentrations and the influence of meningitis

Affiliations

Development of a physiologically-based pharmacokinetic pediatric brain model for prediction of cerebrospinal fluid drug concentrations and the influence of meningitis

Laurens F M Verscheijden et al. PLoS Comput Biol. .

Abstract

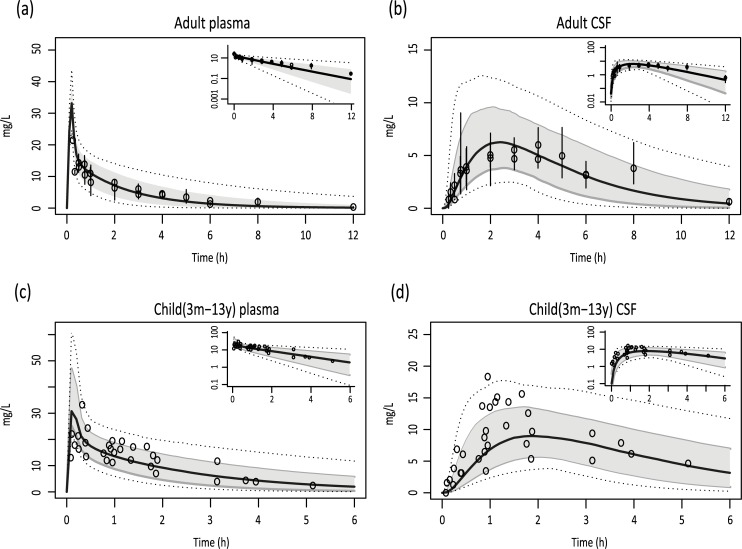
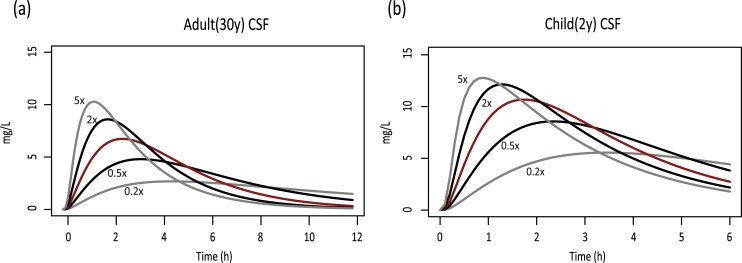
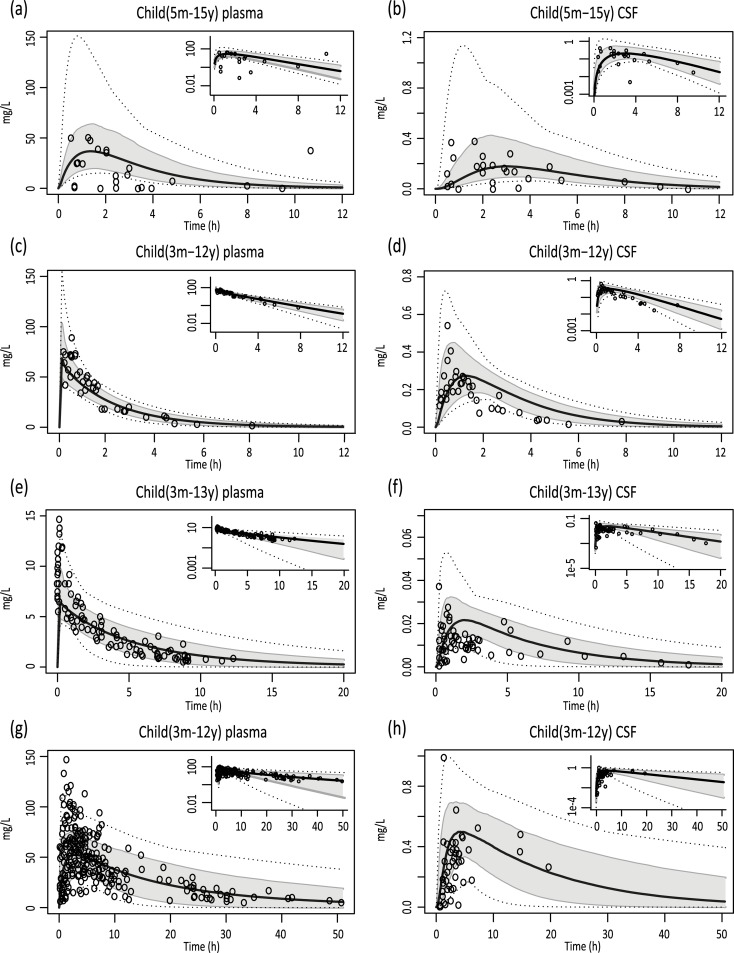
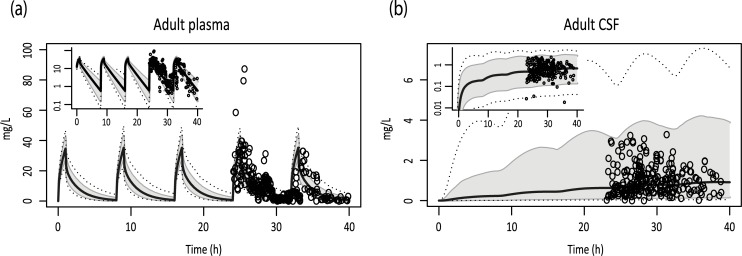
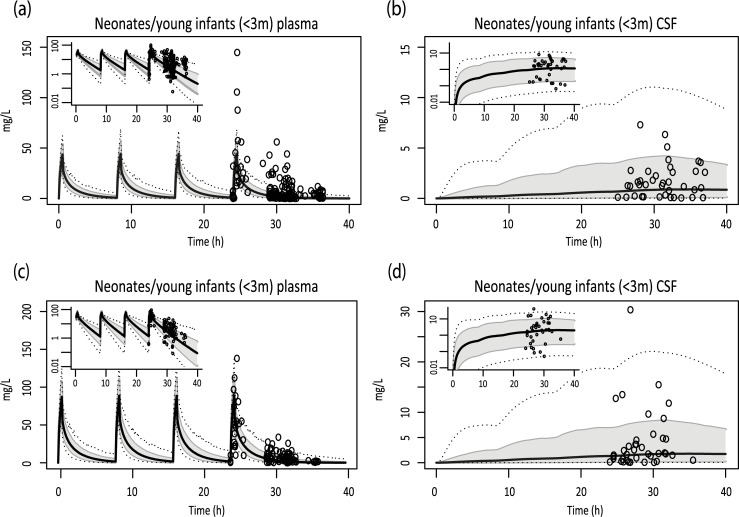
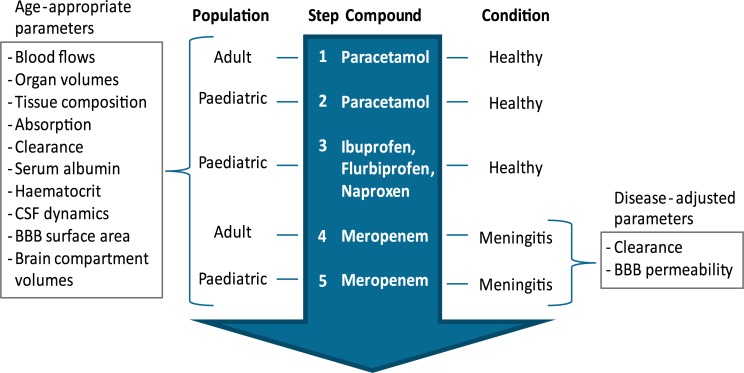
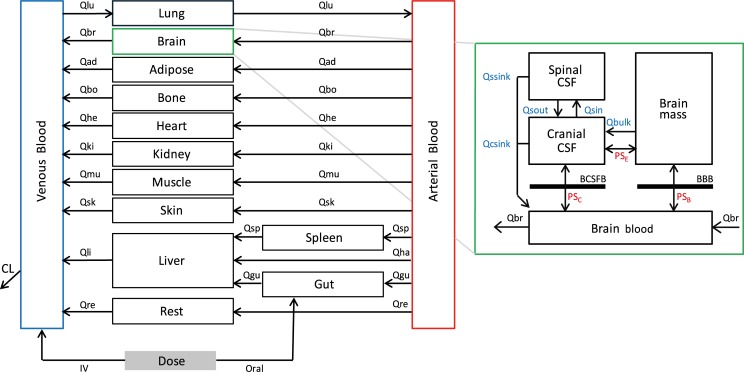
Different pediatric physiologically-based pharmacokinetic (PBPK) models have been described incorporating developmental changes that influence plasma drug concentrations. Drug disposition into cerebrospinal fluid (CSF) is also subject to age-related variation and can be further influenced by brain diseases affecting blood-brain barrier integrity, like meningitis. Here, we developed a generic pediatric brain PBPK model to predict CSF concentrations of drugs that undergo passive transfer, including age-appropriate parameters. The model was validated for the analgesics paracetamol, ibuprofen, flurbiprofen and naproxen, and for a pediatric meningitis population by empirical optimization of the blood-brain barrier penetration of the antibiotic meropenem. Plasma and CSF drug concentrations derived from the literature were used to perform visual predictive checks and to calculate ratios between simulated and observed area under the concentration curves (AUCs) in order to evaluate model performance. Model-simulated concentrations were comparable to observed data over a broad age range (3 months-15 years postnatal age) for all drugs investigated. The ratios between observed and simulated AUCs (AUCo/AUCp) were within 2-fold difference both in plasma (range 0.92-1.09) and in CSF (range 0.64-1.23) indicating acceptable model performance. The model was also able to describe disease-mediated changes in neonates and young children (<3m postnatal age) related to meningitis and sepsis (range AUCo/AUCp plasma: 1.64-1.66, range AUCo/AUCp CSF: 1.43-1.73). Our model provides a new computational tool to predict CSF drug concentrations in children with and without meningitis and can be used as a template model for other compounds that passively enter the CNS.


Conflict of interest statement

The authors have declared that no competing interests exist.

Figures

Fig 1
Fig 1. Simulations of paracetamol concentration-time profiles.
Plasma and CSF concentration-time profiles of paracetamol after a single intravenous dose of 1000 mg in adults (A, B) and (15 mg/kg) (C,D) in children. Solid black lines indicate simulation of median profiles, the grey area represents 90% CI and dotted lines indicate the minimum and maximum simulation. Dots indicate measured data derived from clinical studies together with the reported S.E.M (adult) or individual observations (pediatric). Log-transformed results are depicted in the right upper corners.
Fig 2
Fig 2. The effect of CSF production rate on paracetamol CSF concentration-time profiles.
The red lines indicate the simulations using the default CSF production rate. The black lines indicate a twofold increase or reduction in CSF production rate, respectively. The grey lines indicate a fivefold increase or reduction in CSF production rate, respectively.
Fig 3
Fig 3. Simulations of pediatric concentration-time profiles for ibuprofen, flurbiprofen and naproxen.
Simulations of oral ibuprofen (10 mg/kg in suspected sepsis patients) (A,B), IV ibuprofen (10 mg/kg in surgery patients) (C,D), IV flurbiprofen (0.9 mg/kg in surgery patients) (E,F), and oral naproxen (10 mg/kg in surgery patients) (G,H) concentration-time profiles. Solid black lines indicate simulation of median profiles, the grey area represents 90% CI and dotted lines indicate the minimum and maximum simulation. Dots indicate measured data derived from clinical studies. Log-transformed concentration-time data are depicted in the right upper corners (0 values were discarded).
Fig 4
Fig 4. Simulations of adult concentration-time profiles for intravenous meropenem in meningitis patients.
Simulations of adult plasma and CSF concentration-time profiles (i.v. 1500 mg/8h) (A,B). Solid black lines indicate simulated median profiles, the grey area represents 90% CI and dotted lines indicate the minimum and maximum simulation. Dots indicate measured data derived from clinical studies. Log-transformed results are depicted in the left upper corners.
Fig 5
Fig 5. Simulations of pediatric concentration-time profiles for intravenous meropenem.
Simulations of plasma and CSF for patients suffering from sepsis (i.v. 20 mg/kg/8h) (A,B), or meningitis (i.v. 40 mg/kg/8h) (C,D). Solid black lines indicate simulated median profiles, the grey area represents 90% CI and dotted lines indicate the minimum and maximum simulation. Dots indicate measured data derived from clinical studies. Log-transformed results are depicted in the left upper corners.
Fig 6
Fig 6. Workflow used for the building and validation of the pediatric brain PBPK model.
Fig 7
Fig 7. Schematic outline of the PBPK model including four brain compartments (modified from Gaohua et al.) [8].
Qsin and Qsout represent CSF shuttle flow between cranial CSF and spinal CSF compartments. Qssink and Qcsink are the flows from CSF compartments to blood. Qbulk represents bulk flow from brain mass to cranial CSF. PSB, PSC and PSE represent permeability surface area products between brain blood and brain mass, brain blood and cranial CSF, and brain mass and cranial CSF, respectively. Subscripts lu, br, ad, bo, he, ki, mu, sk, li, re, gu, sp, ha denote lung, brain, adipose tissue, bone, heart, kidney, muscle, skin, liver, rest tissue, gut, spleen and hepatic artery, respectively. CL is the total clearance from the model. IV is an intravenous dose and oral is an oral dose route of administration.

Similar articles

Cited by

References

    1. Johnson TN. The problems in scaling adult drug doses to children. Arch Dis Child. 2008;93(3):207–11. Epub 2007/03/17. 10.1136/adc.2006.114835 . - DOI - PubMed
    1. Templeton IE, Jones NS, Musib L. Pediatric Dose Selection and Utility of PBPK in Determining Dose. AAPS J. 2018;20(2):31 Epub 2018/02/15. 10.1208/s12248-018-0187-8 . - DOI - PubMed
    1. Lu J, Goldsmith MR, Grulke CM, Chang DT, Brooks RD, Leonard JA, et al. Developing a Physiologically-Based Pharmacokinetic Model Knowledgebase in Support of Provisional Model Construction. PLoS Comput Biol. 2016;12(2):e1004495 Epub 2016/02/13. 10.1371/journal.pcbi.1004495 - DOI - PMC - PubMed
    1. Jamei M. Recent Advances in Development and Application of Physiologically-Based Pharmacokinetic (PBPK) Models: a Transition from Academic Curiosity to Regulatory Acceptance. Curr Pharmacol Rep. 2016;2:161–9. 10.1007/s40495-016-0059-9 - DOI - PMC - PubMed
    1. Kim A, McCully C, Cruz R, Cole DE, Fox E, Balis FM, et al. The plasma and cerebrospinal fluid pharmacokinetics of sorafenib after intravenous administration in non-human primates. Invest New Drugs. 2012;30(2):524–8. 10.1007/s10637-010-9585-1 . - DOI - PMC - PubMed