

Epidemiology of respiratory infections among adults in Qatar (2012-2017)
- PMID: 31194775
- PMCID: PMC6563968
- DOI: 10.1371/journal.pone.0218097
Epidemiology of respiratory infections among adults in Qatar (2012-2017)
Abstract
Background: Limited data is available about the etiology of influenza like illnesses (ILIs) in Qatar.
Objectives: This study aimed at providing preliminary estimates of influenza and other respiratory infections circulating among adults in Qatar.
Methods: We retrospectively collected data of about 44,000 patients who visited Hamad General Hospital clinics, sentinel sites, and all primary healthcare centers in Qatar between 2012 and 2017. All samples were tested for influenza viruses, whereas about 38,000 samples were tested for influenza and a panel of respiratory viruses using Fast Track Diagnostics (FTD) RT-PCR kit.
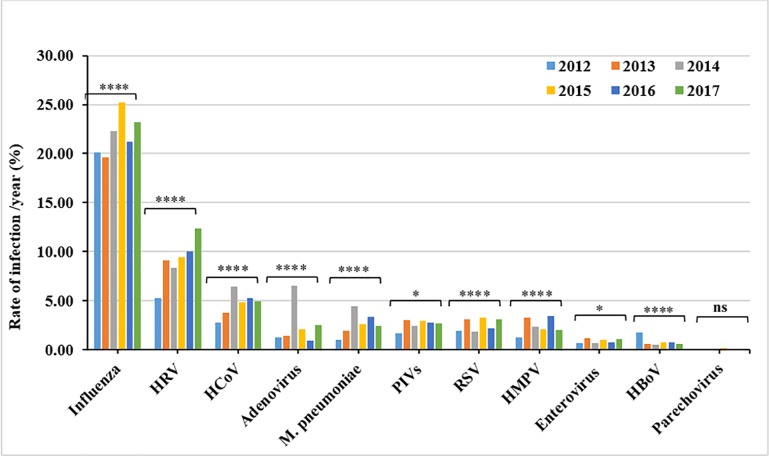
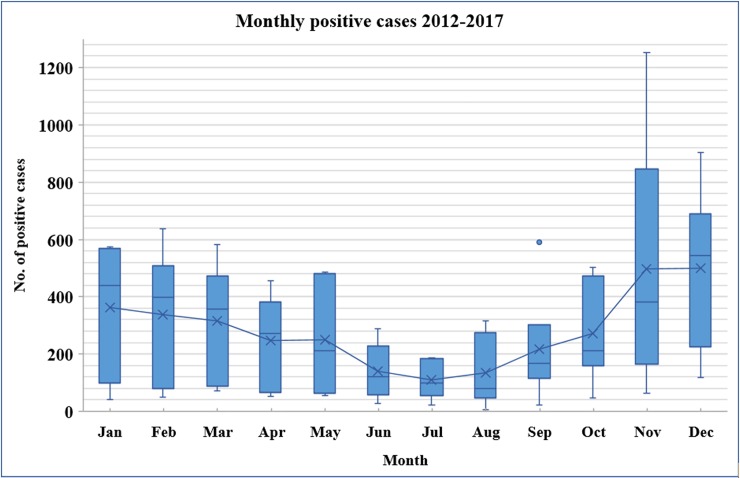
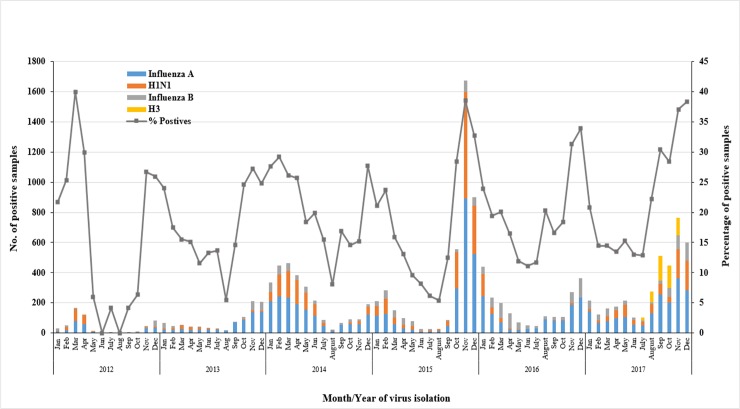
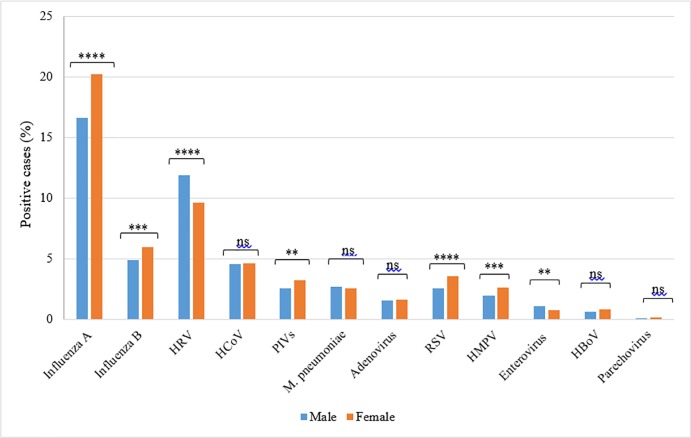
Results: Among all ILIs cases, 20,278 (46.5%) tested positive for at least one respiratory pathogen. Influenza virus was predominating (22.6%), followed by human rhinoviruses (HRVs) (9.5%), and human coronaviruses (HCoVs) (5%). A detection rate of 2-3% was recorded for mycoplasma pneumonia, adenoviruses, human parainfluenza viruses (HPIVs), respiratory syncytial virus (RSV), and human metapneumovirus (HMPV). ILIs cases were reported throughout the year, however, influenza, RSV, and HMPV exhibited strong seasonal peaks in the winter, while HRVs circulated more during fall and spring. Elderly (>50 years) had the lowest rates of influenza A (13.9%) and B (4.2%), while presenting the highest rates of RSV (3.4%) and HMPV (3.3%). While males had higher rates of HRVs (11.9%), enteroviruses (1.1%) and MERS CoV (0.2%), females had higher proportions of influenza (26.3%), HPIVs (3.2%) and RSV (3.6%) infections.
Conclusion: This report provides a comprehensive insight about the epidemiology of ILIs among adults in the Qatar, as a representative of Gulf States. These results would help in improvement and optimization of diagnostic procedures, as well as control and prevention of the respiratory infections.
Conflict of interest statement
The authors have declared that no competing interests exist.
Figures

Similar articles
-
Molecular epidemiology of influenza, RSV, and other respiratory infections among children in Qatar: A six years report (2012-2017).Int J Infect Dis. 2020 Jun;95:133-141. doi: 10.1016/j.ijid.2020.04.008. Epub 2020 Apr 9. Int J Infect Dis. 2020. PMID: 32278934 Free PMC article.
-
[Prevalence and seasonal distribution of respiratory viruses in patients with acute respiratory tract infections, 2002-2014].Mikrobiyol Bul. 2015 Apr;49(2):188-200. doi: 10.5578/mb.9024. Mikrobiyol Bul. 2015. PMID: 26167819 Turkish.
-
Prevalence of human respiratory viruses in adults with acute respiratory tract infections in Beijing, 2005-2007.Clin Microbiol Infect. 2009 Dec;15(12):1146-53. doi: 10.1111/j.1469-0691.2009.02746.x. Epub 2009 May 18. Clin Microbiol Infect. 2009. PMID: 19456830 Free PMC article.
-
Respiratory viral infections in immunocompetent and immunocompromised persons.Am J Med. 1997 Mar 17;102(3A):2-9; discussion 25-6. doi: 10.1016/s0002-9343(97)00003-x. Am J Med. 1997. PMID: 10868136 Free PMC article. Review.
-
Intervention strategies for emerging respiratory virus infections: policy and public health considerations.Curr Opin Virol. 2013 Apr;3(2):192-8. doi: 10.1016/j.coviro.2013.02.004. Epub 2013 Mar 9. Curr Opin Virol. 2013. PMID: 23477831 Free PMC article. Review.
Cited by
-
Demographic and clinical characteristics of human bocavirus-1 infection in patients with acute respiratory tract infections during the COVID-19 pandemic in the Central Province of Sri Lanka.BMC Infect Dis. 2023 Jun 22;23(1):425. doi: 10.1186/s12879-023-08312-x. BMC Infect Dis. 2023. PMID: 37349687 Free PMC article.
-
The Scope of Respiratory Syncytial Virus Infection in a Tertiary Hospital in the Eastern Province of Saudi Arabia and the Change in Seasonal Pattern during and after the COVID-19 Pandemic.Medicina (Kaunas). 2022 Nov 10;58(11):1623. doi: 10.3390/medicina58111623. Medicina (Kaunas). 2022. PMID: 36363580 Free PMC article.
-
Immunological aspects and gender bias during respiratory viral infections including novel Coronavirus disease-19 (COVID-19): A scoping review.J Med Virol. 2021 Sep;93(9):5295-5309. doi: 10.1002/jmv.27081. Epub 2021 May 19. J Med Virol. 2021. PMID: 33990972 Free PMC article.
-
Epidemiology, co-infection, and seasonal patterns of respiratory tract infections in a tertiary care center in Saudi Arabia between 2021 and 2022.Front Public Health. 2025 Apr 2;13:1492653. doi: 10.3389/fpubh.2025.1492653. eCollection 2025. Front Public Health. 2025. PMID: 40265050 Free PMC article.
-
Biological Properties of SARS-CoV-2 Variants: Epidemiological Impact and Clinical Consequences.Vaccines (Basel). 2022 Jun 9;10(6):919. doi: 10.3390/vaccines10060919. Vaccines (Basel). 2022. PMID: 35746526 Free PMC article. Review.
References
-
- Up to 650 000 people die of respiratory diseases linked to seasonal flu each year: WHO; 2017 [
-
- Monto AS. Epidemiology of viral respiratory infections. The American Journal of Medicine. 2002;112(6):4–12. - PubMed
-
- Caini S, El-Guerche Séblain C, Ciblak MA, Paget J. Epidemiology of seasonal influenza in the Middle East and North Africa regions, 2010–2016: Circulating influenza A and B viruses and spatial timing of epidemics. Influenza Other Respir Viruses. 2018;12(3):344–52. 10.1111/irv.12544 - DOI - PMC - PubMed
Publication types
MeSH terms
LinkOut - more resources
Full Text Sources
Medical
