. 2019 Jun 13;14(6):e0218093.
doi: 10.1371/journal.pone.0218093. eCollection 2019.

Building a stakeholder-led common vision increases the expected cost-effectiveness of biodiversity conservation

Affiliations

Building a stakeholder-led common vision increases the expected cost-effectiveness of biodiversity conservation

Rocío Ponce Reyes et al. PLoS One. .

Abstract

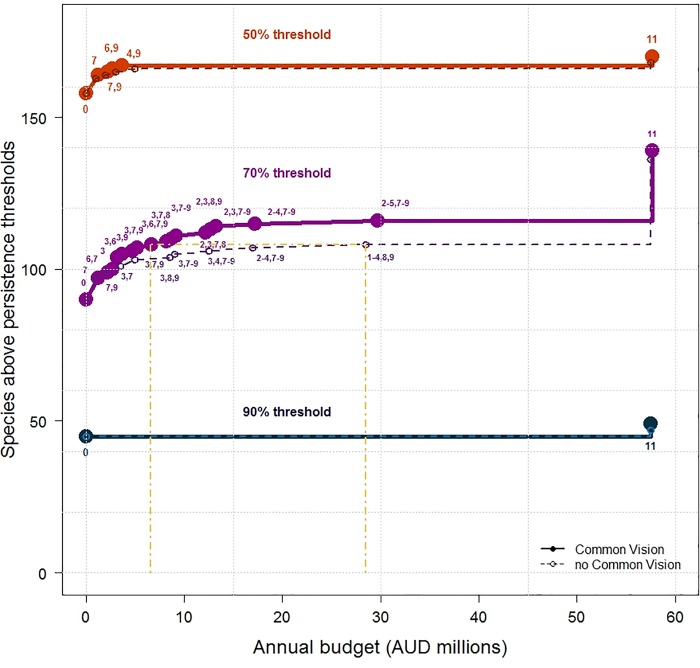
Uniting diverse stakeholders through communication, education or building a collaborative 'common vision' for biodiversity management is a recommended approach for enabling effective conservation in regions with multiple uses. However, socially focused strategies such as building a collaborative vision can require sharing scarce resources (time and financial resources) with the on-ground management actions needed to achieve conservation outcomes. Here we adapt current prioritisation tools to predict the likely return on the financial investment of building a stakeholder-led vision along with a portfolio of on-ground management strategies. Our approach brings together and analyses expert knowledge to estimate the cost-effectiveness of a common vision strategy and on-ground management strategies, before any investments in these strategies are made. We test our approach in an intensively-used Australian biodiversity hotspot with 179 threatened or at-risk species. Experts predicted that an effective stakeholder vision for the region would have a relatively low cost and would significantly increase the feasibility of on-ground management strategies. As a result, our analysis indicates that a common vision is likely to be a cost-effective investment, increasing the expected persistence of threatened species in the region by 9 to 52%, depending upon the strategies implemented. Our approach can provide the maximum budget that is worth investing in building a common vision or another socially focused strategy for building support for on-ground conservation actions. The approach can assist with decisions about whether and how to allocate scarce resources amongst social and ecological actions for biodiversity conservation in other regions worldwide.


Conflict of interest statement

The authors have declared that no competing interests exist.

Figures

Fig 1
Fig 1. Diagram of the methods adopted in this study.
Fig 2
Fig 2. The Brigalow Belt bioregion.
Our study region is located in central and north Queensland, Australia. It covers a total area of about 35 million ha, almost as big as Germany. This bioregion is named after the region’s once-dominant tree species, Acacia harpophylla F. Muell. ex Benth. It has been estimated that since mid-19th century, 7 million ha of brigalow forest (92% of its original extent) have been cleared in the bioregion. Source: Environment and Science, Queensland Government, Remnant vegetation cover—2015—Queensland, licensed under Creative Commons Attribution 4.0 2015.
Fig 3
Fig 3. Key conservation strategies appraisal for threatened species across the Brigalow Belt bioregion in Queensland.
a) average potential benefits (percentage improvement in species persistence averaged across all species for each management strategy); b) annualised average costs of each strategy and threshold break-even value (BEv) of the common vision when implemented with each strategy; c) feasibility values (0–1) with and without the common vision; d) cost-effectiveness (CE) of each management strategy for all species combined with and without the common vision.
Fig 4
Fig 4. Number of species above different persistent thresholds: 50% (orange), 70% (purple) and 90% (indigo) with the common vision (solid lines) and without the common vision (dashed lines) considering different levels of investment optimally and effectively spent on specific threat management.
The numbers above the points represent the combination of strategies (S3 Table). For the 50% and 90% thresholds the same bundles of strategies were selected at each budget with and without the common vision. For the 70% threshold only the first two strategies (7 and 7, 9) coincided with and without the common vision. Yellow dashed lines show the difference in cost of securing 108 species to a 70% probability of persistence without the common vision ($28.5 m/year) compared to only $6.5 m/ year if the common vision is implemented.

References

    1. Venter O, Sanderson EW, Magrach A, Allan JR, Beher J, Jones KR, et al. Sixteen years of change in the global terrestrial human footprint and implications for biodiversity conservation. Nature Communications. 2016;7:12558 10.1038/ncomms12558 - DOI - PMC - PubMed
    1. Butchart SHM, Walpole M, Collen B, van Strien A, Scharlemann JPW, Almond REA, et al. Global Biodiversity: Indicators of Recent Declines. Science. 2010;328(5982):1164–8. 10.1126/science.1187512 - DOI - PubMed
    1. Newbold T, Hudson LN, Hill SLL, Contu S, Lysenko I, Senior RA, et al. Global effects of land use on local terrestrial biodiversity. Nature. 2015;520(7545):45–50. 10.1038/nature14324 - DOI - PubMed
    1. Game ET, Meijaard E, Sheil D, McDonald-Madden E. Conservation in a Wicked Complex World; Challenges and Solutions. Conservation Letters. 2014;7:271–7. 10.1111/conl.12050 - DOI
    1. McShane TO, Hirsch PD, Trung TC, Songorwa AN, Kinzig A, Monteferri B, et al. Hard choices: Making trade-offs between biodiversity conservation and human well-being. Biological Conservation. 2011;144(3):966–72.

Publication types