. 2019 Jun 13;14(6):e0218160.
doi: 10.1371/journal.pone.0218160. eCollection 2019.

Four climate change scenarios for Gypsophila bermejoi G. López (Caryophyllaceae) to address whether bioclimatic and soil suitability will overlap in the future

Affiliations

Four climate change scenarios for Gypsophila bermejoi G. López (Caryophyllaceae) to address whether bioclimatic and soil suitability will overlap in the future

Miguel de Luis et al. PLoS One. .

Abstract

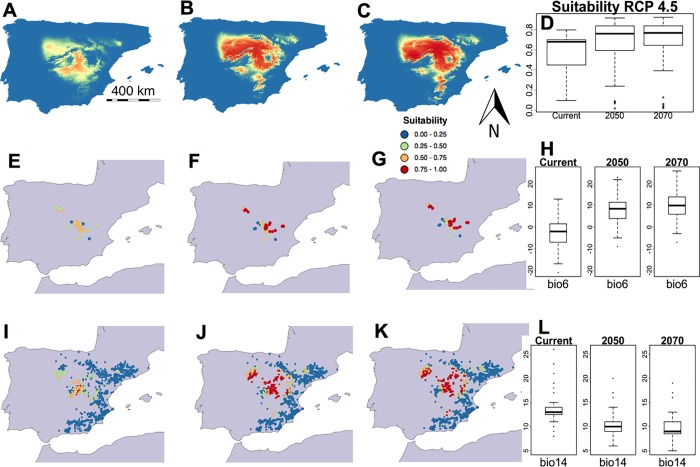
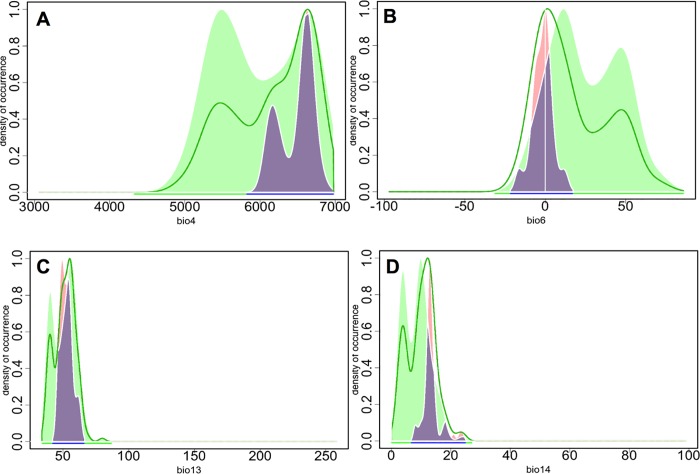
Climate change has altered the global distribution of many species. Accordingly, we have assessed here the potential shift in the distribution of Gypsophila bermejoi G. López under distinct scenarios of future climate change, this being a species endemic to the Iberian Peninsula. For strict gypsophiles, climatic changes affecting their potential area of distribution could be critical if the new range is not overlapped with suitable soils. Thus, the narrow bioclimatic niche and the endemic nature of this plant could make this species particularly vulnerable to climate change. We used the Maximum Entropy (MaxEnt) method to study the potential distribution of this taxon under four different scenarios of climate change, pin-pointing relevant changes in the potential distribution of this plant and enabling possible future areas of refuge to be assessed. Such scenarios are defined according to four Representative Concentration Pathways (RCPs) [, which represent different trends in the concentration of atmospheric carbon dioxide. As a result, we predict notable changes in the potential distribution of G. bermejoi, and the overlap between soil and bioclimatic suitability would be affected. We also used a Principal Component Analysis (PCA) to model the bioclimatic niche of this species, comparing it with that of its parental taxa. The evolution of bioclimatic suitability was assessed at the current locations of G. bermejoi and as this plant is a strict gypsophile, we generated suitability maps for sites with gypsum soils. Ultimately, this study identifies relevant changes in the potential distribution of G. bermejoi under specific climatic scenarios, observing remarkable differences in the outcomes of the different climate change scenarios. Interestingly, in some scenarios the bioclimatic suitability of G. bermejoi will be enhanced at many locations and even in the worst scenario some possible refuge areas were identified. G. bermejoi behaves more like a hardy survivor than as early victim.


Conflict of interest statement

The authors have declared that no competing interests exist.

Figures

Fig 1
Fig 1
Appearance of G. bermejoi (A). Maps of the Iberian Peninsula showing where this species can be found (B and C) according to GBIF data.
Fig 2
Fig 2. Habitat suitability predicted by the MaxEnt models for G. bermejoi under the RCP 2.6 scenario.
Habitat suitability map for the current climatic conditions (A), those predicted for 2050 (B) and those for 2070 (C). (D) Habitat suitability values in the current climatic conditions (R software standard box-plot), and under those predicted for 2050 and 2070, measured at the sites where this taxon is currently found. In E, F and G, we show the bioclimatic suitability values for the sites where G. bermejoi is currently found. To aid interpretation of these maps, a color code was used to express the different intervals of habitat suitability. (H) These box-plots show the evolution of the values for the Bio 6 variable (the minimum temperature in the coldest month) measured at the sites where G. bermejoi is currently found. The bioclimatic suitability was also measured at each location with gypsum soil indicated by the presence of O. tridentata. These values are shown for the current climatic conditions, and the conditions predicted for 2050 and 2070, in maps I, J and K, respectively. (L) These box-plots are similar to those in (H) but for the values of the Bio 14 variable (precipitation in the driest month), also measured at the locations where G. bermejoi is currently found.
Fig 3
Fig 3. Habitat suitability predicted by the MaxEnt models for G. bermejoi under the RCP 4.5 scenario.
Habitat suitability map for the current climatic conditions (A), and those predicted for 2050 (B) and 2070 (C). (D) Habitat suitability values in the current climatic conditions, and under those predicted for 2050 and 2070 (R software standard box-plot), measured at the sites where this taxon is currently found. In E, F and G, we show the bioclimatic suitability at the sites where G. bermejoi occurs at present. In these maps, a color code was used to express the different intervals of habitat suitability. (H) These box-plots show how the Bio 6 variable values evolve (minimum temperature in the coldest month) at the sites where G. bermejoi is currently found. The bioclimatic suitability was also measured at each location with gypsum soil indicated by the presence of O. tridentata. These values are shown for the current climatic conditions, and under the conditions predicted for 2050 and 2070, in maps I, J and K, respectively. (L) These box-plots are similar to those in (H) for the values of the Bio 14 variable (precipitation in the driest month), also measured at the locations where G. bermejoi is currently found.
Fig 4
Fig 4. Habitat suitability predicted by the MaxEnt models for G. bermejoi under the RCP 6 scenario.
Habitat suitability map for the current climatic conditions (A), and for those predicted for 2050 (B) and 2070 (C). (D) Habitat suitability values (R software standard box-plot) in the current climatic conditions, and under those predicted for 2050 and 2070 measured at the sites where the taxon is currently found. In E, F and G, we show the bioclimatic suitability at the sites where G. bermejoi is currently found. A color code was used to express the different intervals of habitat suitability. (H) These box-plots show the evolution of the values of the Bio 6 variable (the minimum temperature in the coldest month) measured at the sites where G. bermejoi is currently found. Bioclimatic suitability was also measured at each location, with gypsum soils indicated by the presence of O. tridentata. These values are shown in maps I, J and K, for the current climatic conditions, and for the conditions predicted for 2050 and 2070, respectively. (L) These box-plots are similar to those in (H) but representing the values of the Bio 14 variable (precipitation in the driest month), also measured at the locations where G. bermejoi is currently found.
Fig 5
Fig 5. Habitat suitability predicted by the MaxEnt models for G. bermejoi under the RCP 8.5 scenario.
Habitat suitability map for the current climatic conditions (A), and under those predicted for 2050 (B) and 2070 (C). (D) Habitat suitability values (R software standard box-plot) in the current climatic conditions, and under those predicted for 2050 and 2070 measured at the sites where the taxon is currently found. In E, F and G, we show the bioclimatic suitability values taken at the sites where G. bermejoi is currently found. A color code was used to express the different intervals of habitat suitability. (H) These box-plots show the evolution of the Bio 6 variable (minimum temperature in the coldest month) measured at the sites where G. bermejoi is currently found. The bioclimatic suitability was also measured at each location for gypsum soils indicated by the presence of O. tridentata. These values are shown in maps I, J and K, for the current climatic conditions, and under the conditions predicted for 2050 and 2070, respectively. (L) These box-plots are similar to those in (H) but for the Bio 14 variable (precipitation in the driest month), also measured at the locations where G. bermejoi is currently found.
Fig 6
Fig 6
Bioclimatic niches of G. bermejoi and its parental species (A and D). The environmental space is defined by the first two axes of the PCA analysis, and it is limited by the minimum and maximum environmental values in the whole study area. The different taxa have been plotted in pairs to make comparisons easier: (A) G. bermejoi (red) vs. G. struthium subsp. struthium (blue); (D) G. bermejoi (red) vs. G tomentosa). Note that G. bermejoi has a narrower niche in both cases. B and E show the correlation circles for the variables used in the PCAs. The appearance of the parental taxa of G. bermejoi is shown in C (G. struthium subsp. struthium) and F (G. tomentosa).
Fig 7
Fig 7. Occurrence density curves for specific bioclimatic variables of G. bermejoi (pink) and G. struthium subsp. struthium (green).
The pale violet areas represent overlapping areas under the curves. Again, the narrow bioclimatic niche of G. bermejoi becomes evident.

Similar articles

Cited by

References

    1. Houghton JT, Ding YD, Griggs D J, Noguer M, van der Linden PJ, Dai X, et al. Climate change 2001: the scientific basis. The Press Syndicate of the University of Cambridge, 2001.
    1. Root TL, Price JT, Hall KR, Schneider SH, Rosenzwei C, Pounds JA. Fingerprints of global warming on wild animals and plants. Nature, 2003; vol. 421, no 6918, p. 57 10.1038/nature01333 - DOI - PubMed
    1. Thuiller W, Lavorel S, Araújo MB, Sykes M, Prentice IC. Climate change threats to plant diversity in Europe. Proceedings of the National Academy of Sciences of the United States of America, 2005; vol. 102, no 23, p. 8245–8250. 10.1073/pnas.0409902102 - DOI - PMC - PubMed
    1. Parmesan C, Yoh G. A globally coherent fingerprint of climate change impacts across natural systems. Nature, 2003; vol. 421, no 6918, p. 37 10.1038/nature01286 - DOI - PubMed
    1. Walther GR, Post E, Convey P, Menzel A, Parmesan C, Beebee TJ, et al. Ecological responses to recent climate change. Nature, 2002; vol. 416, no 6879, p. 389 10.1038/416389a - DOI - PubMed

Publication types