

GWAS and PheWAS of red blood cell components in a Northern Nevadan cohort
- PMID: 31194788
- PMCID: PMC6564422
- DOI: 10.1371/journal.pone.0218078
GWAS and PheWAS of red blood cell components in a Northern Nevadan cohort
Abstract
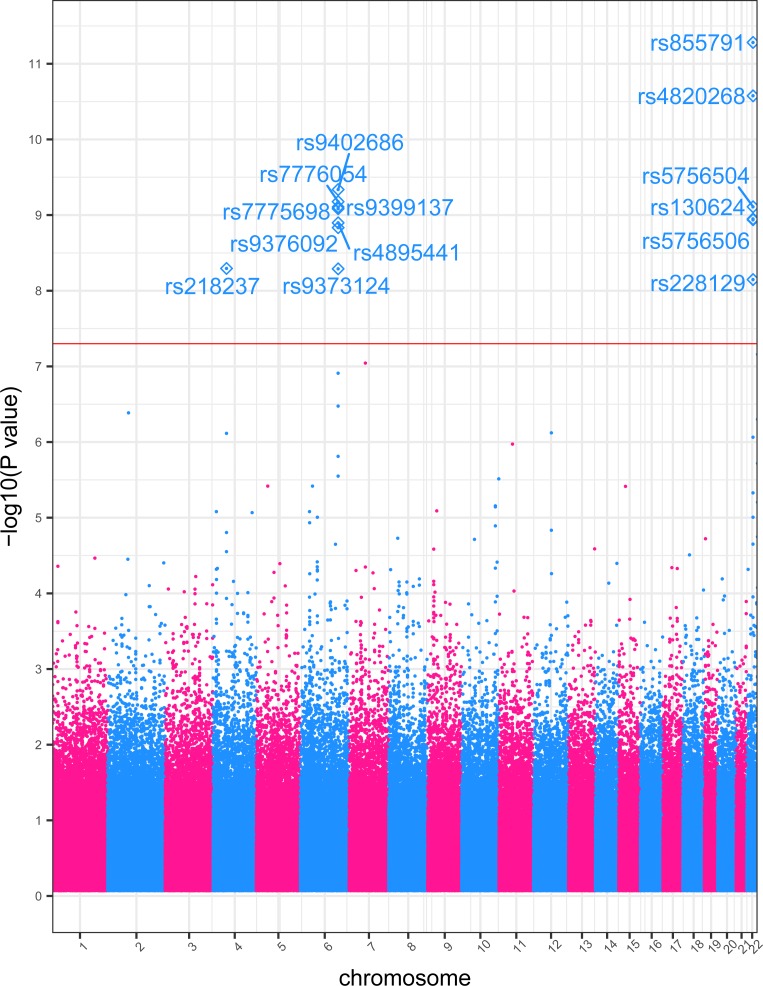
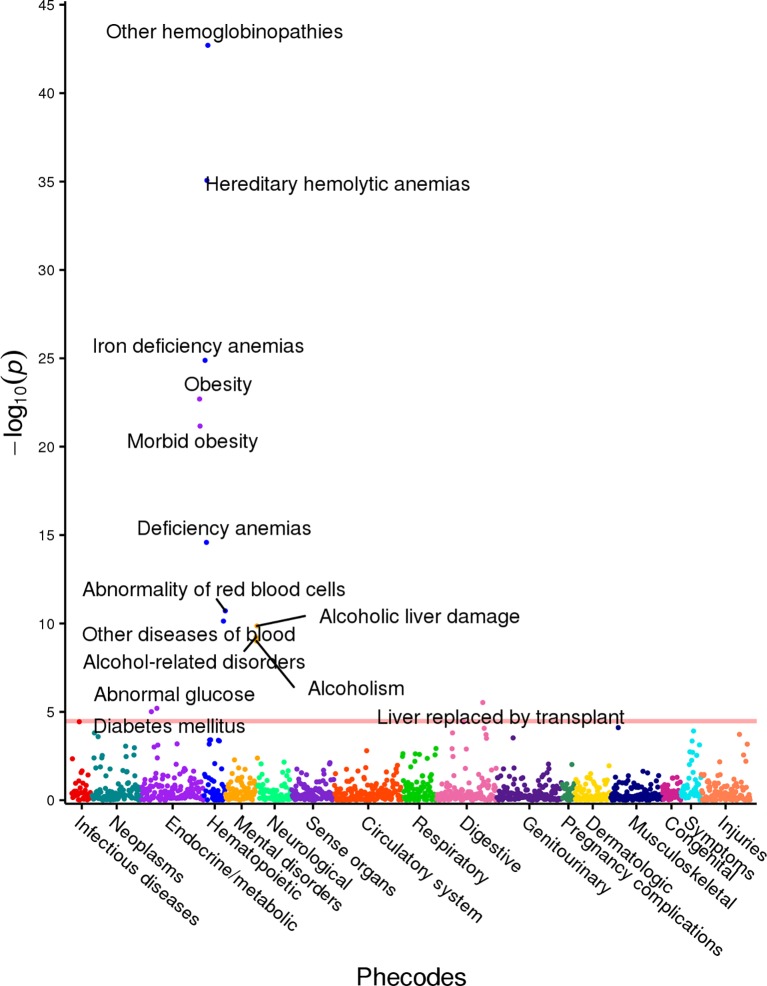
In this study, we perform a full genome-wide association study (GWAS) to identify statistically significantly associated single nucleotide polymorphisms (SNPs) with three red blood cell (RBC) components and follow it with two independent PheWASs to examine associations between phenotypic data (case-control status of diagnoses or disease), significant SNPs, and RBC component levels. We first identified associations between the three RBC components: mean platelet volume (MPV), mean corpuscular volume (MCV), and platelet counts (PC), and the genotypes of approximately 500,000 SNPs on the Illumina Infimum DNA Human OmniExpress-24 BeadChip using a single cohort of 4,673 Northern Nevadans. Twenty-one SNPs in five major genomic regions were found to be statistically significantly associated with MPV, two regions with MCV, and one region with PC, with p<5x10⁻⁸. Twenty-nine SNPs and nine chromosomal regions were identified in 30 previous GWASs, with effect sizes of similar magnitude and direction as found in our cohort. The two strongest associations were SNP rs1354034 with MPV (p = 2.4x10⁻¹³) and rs855791 with MCV (p = 5.2x10⁻¹²). We then examined possible associations between these significant SNPs and incidence of 1,488 phenotype groups mapped from International Classification of Disease version 9 and 10 (ICD9 and ICD10) codes collected in the extensive electronic health record (EHR) database associated with Healthy Nevada Project consented participants. Further leveraging data collected in the EHR, we performed an additional PheWAS to identify associations between continuous red blood cell (RBC) component measures and incidence of specific diagnoses. The first PheWAS illuminated whether SNPs associated with RBC components in our cohort were linked with other hematologic phenotypic diagnoses or diagnoses of other nature. Although no SNPs from our GWAS were identified as strongly associated to other phenotypic components, a number of associations were identified with p-values ranging between 1x10⁻³ and 1x10⁻⁴ with traits such as respiratory failure, sleep disorders, hypoglycemia, hyperglyceridemia, GERD and IBS. The second PheWAS examined possible phenotypic predictors of abnormal RBC component measures: a number of hematologic phenotypes such as thrombocytopenia, anemias, hemoglobinopathies and pancytopenia were found to be strongly associated to RBC component measures; additional phenotypes such as (morbid) obesity, malaise and fatigue, alcoholism, and cirrhosis were also identified to be possible predictors of RBC component measures.
Conflict of interest statement
This commercial affiliation [23andMe] does not alter our adherence to PLOS ONE policies on sharing data and materials.
Figures
Similar articles
-
A Comprehensive Genome-Wide and Phenome-Wide Examination of BMI and Obesity in a Northern Nevadan Cohort.G3 (Bethesda). 2020 Feb 6;10(2):645-664. doi: 10.1534/g3.119.400910. G3 (Bethesda). 2020. PMID: 31888951 Free PMC article.
-
INTEGRATING CLINICAL LABORATORY MEASURES AND ICD-9 CODE DIAGNOSES IN PHENOME-WIDE ASSOCIATION STUDIES.Pac Symp Biocomput. 2016;21:168-79. Pac Symp Biocomput. 2016. PMID: 26776183 Free PMC article.
-
A genome- and phenome-wide association study to identify genetic variants influencing platelet count and volume and their pleiotropic effects.Hum Genet. 2014 Jan;133(1):95-109. doi: 10.1007/s00439-013-1355-7. Epub 2013 Sep 12. Hum Genet. 2014. PMID: 24026423 Free PMC article.
-
The challenges, advantages and future of phenome-wide association studies.Immunology. 2014 Feb;141(2):157-65. doi: 10.1111/imm.12195. Immunology. 2014. PMID: 24147732 Free PMC article. Review.
-
Phenome-wide association studies: a new method for functional genomics in humans.J Physiol. 2017 Jun 15;595(12):4109-4115. doi: 10.1113/JP273122. Epub 2017 Mar 26. J Physiol. 2017. PMID: 28229460 Free PMC article. Review.
Cited by
-
A phenome-wide association study of genetically mimicked statins.BMC Med. 2021 Jun 30;19(1):151. doi: 10.1186/s12916-021-02013-5. BMC Med. 2021. PMID: 34187478 Free PMC article.
-
Assessing the impact of alcohol consumption on the genetic contribution to mean corpuscular volume.Hum Mol Genet. 2021 Oct 13;30(21):2040-2051. doi: 10.1093/hmg/ddab147. Hum Mol Genet. 2021. PMID: 34104963 Free PMC article.
-
Secondary analyses for genome-wide association studies using expression quantitative trait loci.Genet Epidemiol. 2022 Apr;46(3-4):170-181. doi: 10.1002/gepi.22448. Epub 2022 Mar 21. Genet Epidemiol. 2022. PMID: 35312098 Free PMC article.
-
Platelet index ratios in HIV: Emerging biomarkers for immune health and disease management.Medicine (Baltimore). 2024 Mar 22;103(12):e37576. doi: 10.1097/MD.0000000000037576. Medicine (Baltimore). 2024. PMID: 38518025 Free PMC article.
-
EpoR stimulates rapid cycling and larger red cells during mouse and human erythropoiesis.Nat Commun. 2021 Dec 17;12(1):7334. doi: 10.1038/s41467-021-27562-4. Nat Commun. 2021. PMID: 34921133 Free PMC article. Clinical Trial.
References
-
- Simone G de, Devereux RB, Chinali M, Best LG, Lee ET, Welty TK. Association of Blood Pressure With Blood Viscosity in American Indians The Strong Heart Study. Hypertension. 2005;45: 625–630. 10.1161/01.HYP.0000157526.07977.ec - DOI - PubMed
Publication types
MeSH terms
LinkOut - more resources
Full Text Sources
