. 2019 Jun 13;14(6):e0218279.
doi: 10.1371/journal.pone.0218279. eCollection 2019.

ZEB1 insufficiency causes corneal endothelial cell state transition and altered cellular processing

Affiliations

ZEB1 insufficiency causes corneal endothelial cell state transition and altered cellular processing

Ricardo F Frausto et al. PLoS One. .

Abstract

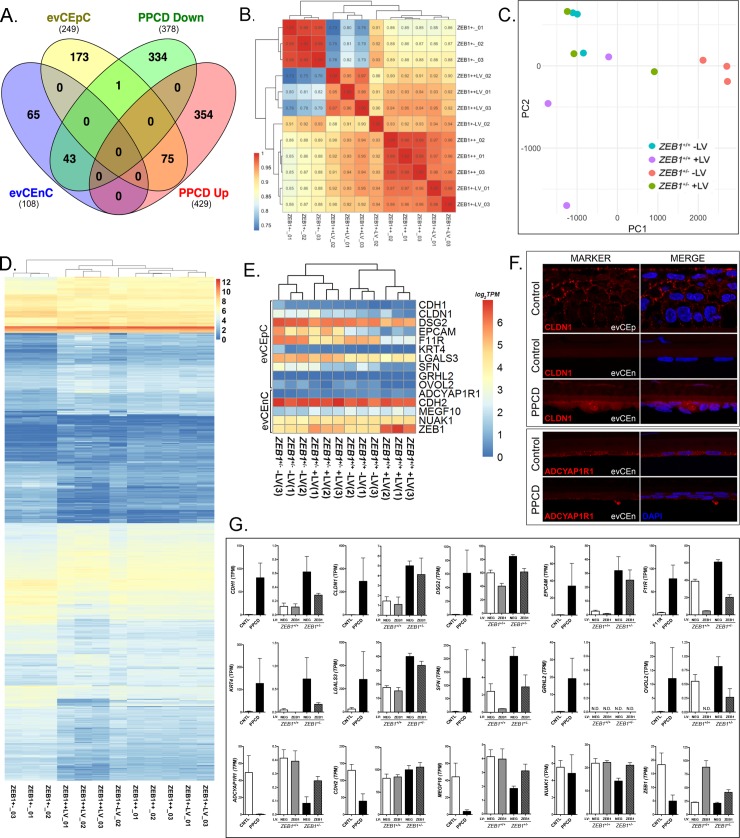
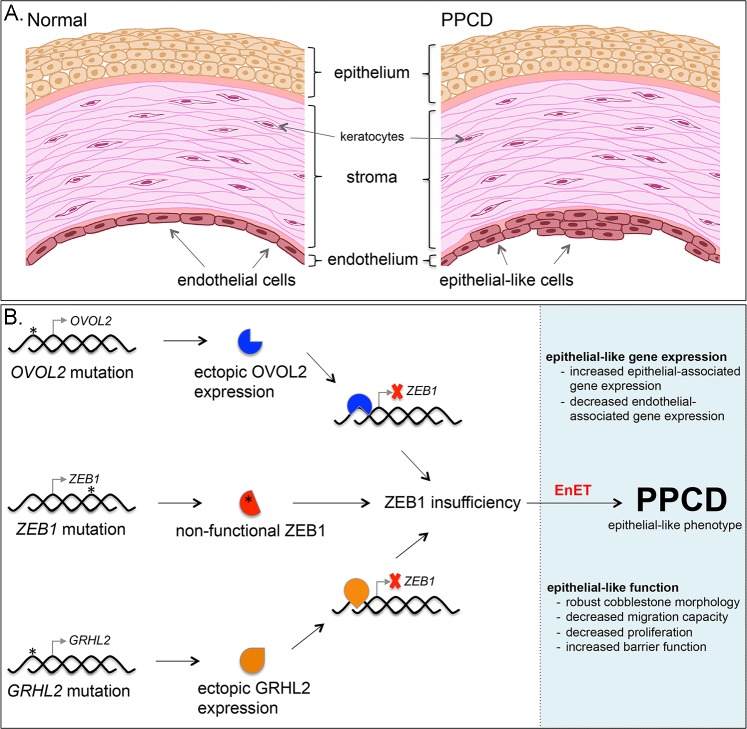
The zinc finger e-box binding homeobox 1 (ZEB1) transcription factor is a master regulator of the epithelial to mesenchymal transition (EMT), and of the reverse mesenchymal to epithelial transition (MET) processes. ZEB1 plays an integral role in mediating cell state transitions during cell lineage specification, wound healing and disease. EMT/MET are characterized by distinct changes in molecular and cellular phenotype that are generally context-independent. Posterior polymorphous corneal dystrophy (PPCD), associated with ZEB1 insufficiency, provides a new biological context in which to understand and evaluate the classic EMT/MET paradigm. PPCD is characterized by a cadherin-switch and transition to an epithelial-like transcriptomic and cellular phenotype, which we study in a cell-based model of PPCD generated using CRISPR-Cas9-mediated ZEB1 knockout in corneal endothelial cells (CEnCs). Transcriptomic and functional studies support the hypothesis that CEnC undergo a MET-like transition in PPCD, termed endothelial to epithelial transition (EnET), and lead to the conclusion that EnET may be considered a corollary to the classic EMT/MET paradigm.


Conflict of interest statement

The authors have declared that no competing interests exist.

Figures

Fig 1
Fig 1. Transcriptomic analysis of the ZEB1+/- CEnC line validates it as a model of PPCD.
(A) Venn diagram comparing genes specifically expressed by ex vivo corneal epithelial cells (evCEpC) and ex vivo corneal endothelial cells (evCEnC) with differentially expressed genes in PPCD. (B) Spearman correlation heat map, (C) principle component analysis, and (D) heat map demonstrating clustering analysis of the four ZEB1 CEnC lines and a combined list of 1031 genes that showed significant differential expression in at least one of the three cell lines (ZEB1+/+ +LV, ZEB1+/- -LV, and ZEB1+/- +LV) compared with ZEB1+/+. (E) Hierarchical clustering heat map of selected epithelial- and endothelial-specific genes and ZEB1 CEnC lines. (F) Immunofluorescence showing expression of the epithelial-associated protein CLDN1 and the corneal endothelial-associated protein ADCYAP1R1 in PPCD endothelium. Expression of CLDN1 in corneal epithelium (evCEp) was used as a positive control. CLDN1 and ADCYAP1R1 were visualized with Alexafluor 594 (red), and nuclei were stained with DAPI (blue). (G) Bar graphs showing the expression of selected epithelial- and endothelial-specific genes (see (E)) in PPCD endothelium (n = 3) and in the ZEB1 CEnC lines (n = 3). Gene expression is given in TPMs.
Fig 2
Fig 2. ZEB1 regulates CEnC morphology in a manner consistent with EMT.
(A) Sub-confluent cultures established 1 day after seeding of the two control and two ZEB1 transgenic CEnC lines with each genotype (ZEB1+/+ -LV, ZEB1+/+ +LV, ZEB1+/- -LV and ZEB1+/- +LV) represented by three independent clones (individual images). (B) Confluent cultures of cell line clones shown in (A) established 3 days post-seeding. Scale bars in (A) and (B) represent 100μm distance. (C) Box and whiskers plot showing the cell major axis length (MAL) distribution for each of the CEnC lines. MAL was used to assess cell morphology as a measure of cell state phenotype. Note that a relatively short MAL is indicative of an epithelial-like phenotype, while a relatively long MAL is indicative of a mesenchymal-like phenotype. Box encompasses 50% of data points, line in box is the median of the MAL and whiskers encompass 98% of data points (n = 357–688). Comparisons of the MAL for the CEnC lines were performed using one-way ANOVA with post-hoc Tukey test. ***, P<0.001; N.S., not significant (p>0.05). (D) Western blot showing ZEB1 levels in the twelve clones (3 independent clones per genotype) used in this study. Alpha-tubulin (TUBA) was used as a loading control. (E) ZEB1 protein abundance was determined by densitometric analysis of Western blot data shown in (D). Quantification data are represented as mean ±SEM (n = 3). Bar graphs showing ZEB1 protein (E) and ZEB1 mRNA (F) abundances in the four CEnC lines. ZEB1 transcript abundance was measured relative to GAPDH and plotted as 2-ΔCt.
Fig 3
Fig 3. ZEB1 reduction impairs CEnC migration capacity.
(A) Representative images at 0 hours showing a gap of ~500 μm (width) and at 18 hours showing degree of cell gap closure (i.e., cell migration) for each of the control (ZEB1+/+ NEG-LV and ZEB1+/- NEG-LV) and ZEB1 transgenic (ZEB1+/+ ZEB1-LV and ZEB1+/- ZEB1-LV) CEnC lines. (B) Bar graph showing percent of gap closure at 18 hours. Data are represented as the mean ±SEM (n = 12). Comparisons were performed using one-way ANOVA with post-hoc Tukey test. ***, P<0.001.
Fig 4
Fig 4. ZEB1 reduction impairs CEnC proliferation capacity.
(A) Western blotting results showing ZEB1 levels in each of the CEnC lines following transient ZEB1 overexpression with lentivirus (5 days post-transduction). Alpha-tubulin (TUBA) was used as a loading control. (B) Bar graph showing cell proliferation graphed as the ratio of cell number at time t (Nt) over cell number at 3 hours (N0), Nt/N0. Ratios were calculated at 48, 72 and 96 hours post-seeding. Data were represented as the mean ±SEM (n = 6). Comparisons were performed using two-way ANOVA (genotype and time) with post-hoc Bonferroni test. *, P<0.05; ****, P<0.0001.
Fig 5
Fig 5. ZEB1 modulates cell barrier function in CEnC.
(A) Electrical impedance (Ω at 4000 Hz), a metric of cell barrier function, was measured for up to 96 hours after cells were seeded. (B) Electrical resistance as a result of cell-cell adhesion was modeled from impedance data in (A) and given as Rb (Ω • cm2). (C) Electrical resistance caused by cell-substrate adhesion was modeled from the impedance data in (A) and given as α1/2 • cm). (D) Cell membrane capacitance, influenced by membrane complexity and morphology, was modeled from the impedance data in (A) and given as Cm (μF • cm-2). Filled circle: wild type CEnC (ZEB1+/+ -LV); half-filled circle: ZEB1 heterozygous CEnC (ZEB1+/- -LV); filled square: ZEB1+/+ cells in which ZEB1 levels were augmented using lentivirus, (ZEB1+/+ +LV); half-filled square: ZEB1+/- CEnC in which ZEB1 levels were reconstituted using lentivirus (ZEB1+/- +LV). Data are plotted over 96 hours as the mean ± SEM (n = 3,4). Comparisons were performed using two-way (genotype and time) repeated measures ANOVA with post-hoc Bonferroni test. Horizontal bars above curves represent time ranges for the indicated comparisons that demonstrated statistical significance, P<0.05.
Fig 6
Fig 6. ZEB1 insufficiency does not affect the CEnC response to lactate.
(A-D) Traces showing effect of lactate exposure on intracellular pH (pHi) in the CEnC lines. Note that lactate is co-transported across the membrane with protons. pHi was calculated from fluorescence measurements of cells pre-loaded with the fluorescent pH indicator BCECF. A resting pHi was established before perfusion with lactate (20mM). Arrows indicate addition or removal of lactate. (E) Bar graph showing the maximum change in intracellular proton concentration ([Hi], nM) per second (d[Hi]/dt) after addition of lactate. (F) Bar graph showing the mean of the difference between resting [Hi] and minimum [Hi] achieved after addition of lactate. (G) Bar graph representing the mean of the difference between the pre-lactate resting [Hi] and the post-lactate resting [Hi]. Data in E-G were represented as the mean ±SEM (n = 3). Comparisons in E-G were performed using one-way ANOVA with post-hoc Tukey test. No statistically significant differences were identified.
Fig 7
Fig 7. ZEB1 reduction may alter the CEnC response to UVC-induced apoptosis.
(A) Western results showing levels of TP53 phosphorylated at Serine 15 in whole-cell lysates prepared from the ZEB1 CEnC lines treated either with 0 mJ or 150 mJ of UVC. Representative results from three independent experiments are shown. Detection of total TP53 and GAPDH were used as loading controls. (B) Bar graph representing abundance of pS15-TP53 normalized for loading. Data are represented as the mean ± SEM (n = 3). Statistical analysis was performed using one-way ANOVA with post-hoc Tukey test.
Fig 8
Fig 8. Model for the role of ZEB1 in PPCD characterized by EnET.
(A) Illustration of the cornea depicts the three main cellular layers, the anterior stratified organization of the epithelial cells comprising the epithelium, the collagen-rich stroma containing dispersed keratocytes, and the posterior corneal endothelium, which is characterized by a monolayer of corneal endothelial cells. In PPCD, the corneal endothelium is characterized by foci of epithelial-like cells present in a stratified organization, characteristic of the corneal epithelium. (B) Schematic of the genotype-to-phenotype model of PPCD. Truncating mutations (*) in ZEB1 were the first mutations associated with PPCD. The non-functional mutant protein (red symbol with asterisk) leads to ZEB1 insufficiency and endothelial to epithelial transition (EnET), which forms the basis for the characteristic clinical and histopathologic features of PPCD. Mutations in the promoter region of OVOL2 or GRHL2 release intrinsic repression of these genes and lead to ectopic production of their respective transcription factors in the corneal endothelium. OVOL2 (blue symbol) and GRHL2 (orange symbol) are known to directly repress ZEB1 gene transcription (red X) by binding to the ZEB1 promoter. Consequently, ZEB1 transcription is reduced, leading to ZEB1 insufficiency and EnET.

Similar articles

Cited by

References

    1. Varga J, Greten FR. Cell plasticity in epithelial homeostasis and tumorigenesis. Nat Cell Biol. 2017;19(10):1133–41. 10.1038/ncb3611 - DOI - PubMed
    1. Huang RY, Wong MK, Tan TZ, Kuay KT, Ng AH, Chung VY, et al. An EMT spectrum defines an anoikis-resistant and spheroidogenic intermediate mesenchymal state that is sensitive to e-cadherin restoration by a src-kinase inhibitor, saracatinib (AZD0530). Cell Death Dis. 2013;4:e915 10.1038/cddis.2013.442 - DOI - PMC - PubMed
    1. Zhang J, Tian XJ, Zhang H, Teng Y, Li R, Bai F, et al. TGF-beta-induced epithelial-to-mesenchymal transition proceeds through stepwise activation of multiple feedback loops. Sci Signal. 2014;7(345):ra91 10.1126/scisignal.2005304 - DOI - PubMed
    1. Jolly MK, Tripathi SC, Jia D, Mooney SM, Celiktas M, Hanash SM, et al. Stability of the hybrid epithelial/mesenchymal phenotype. Oncotarget. 2016;7(19):27067–84. 10.18632/oncotarget.8166 - DOI - PMC - PubMed
    1. Bierie B, Pierce SE, Kroeger C, Stover DG, Pattabiraman DR, Thiru P, et al. Integrin-beta4 identifies cancer stem cell-enriched populations of partially mesenchymal carcinoma cells. Proc Natl Acad Sci U S A. 2017;114(12):E2337–E46. 10.1073/pnas.1618298114 - DOI - PMC - PubMed

Publication types

MeSH terms

Supplementary concepts