. 2019 Aug 22;47(14):7348-7362.
doi: 10.1093/nar/gkz504.

Boundaries of eliminated heterochromatin of Tetrahymena are positioned by the DNA-binding protein Ltl1

Affiliations

Boundaries of eliminated heterochromatin of Tetrahymena are positioned by the DNA-binding protein Ltl1

Vita N Jaspan et al. Nucleic Acids Res. .

Abstract

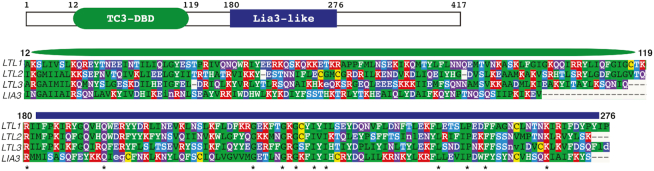
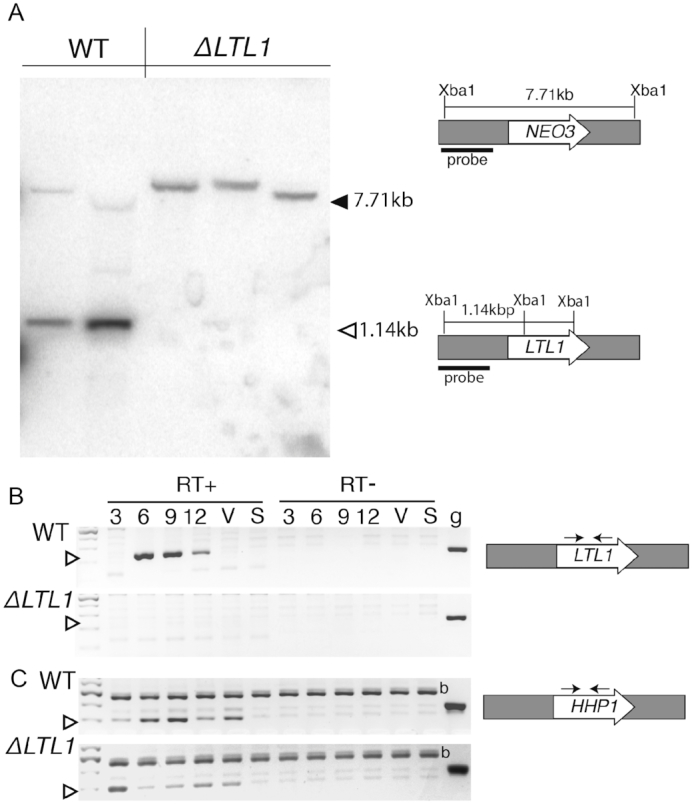
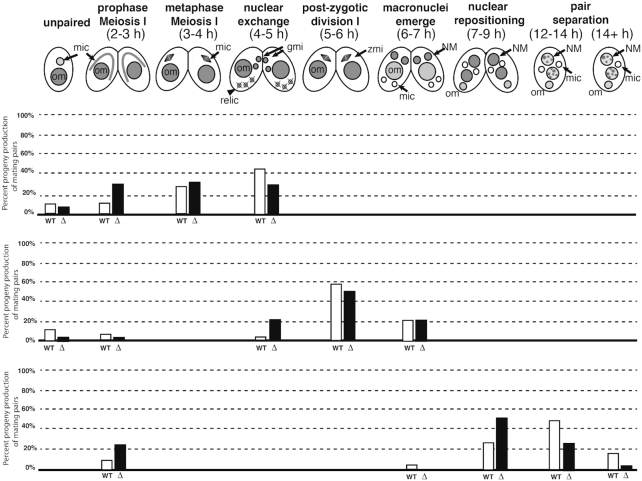
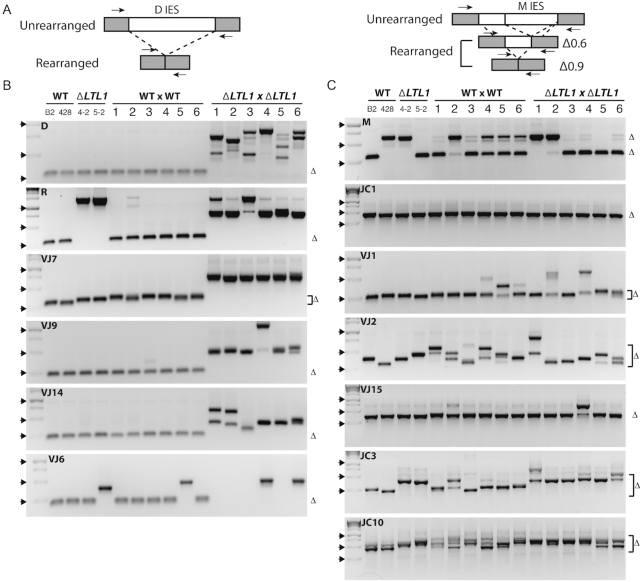
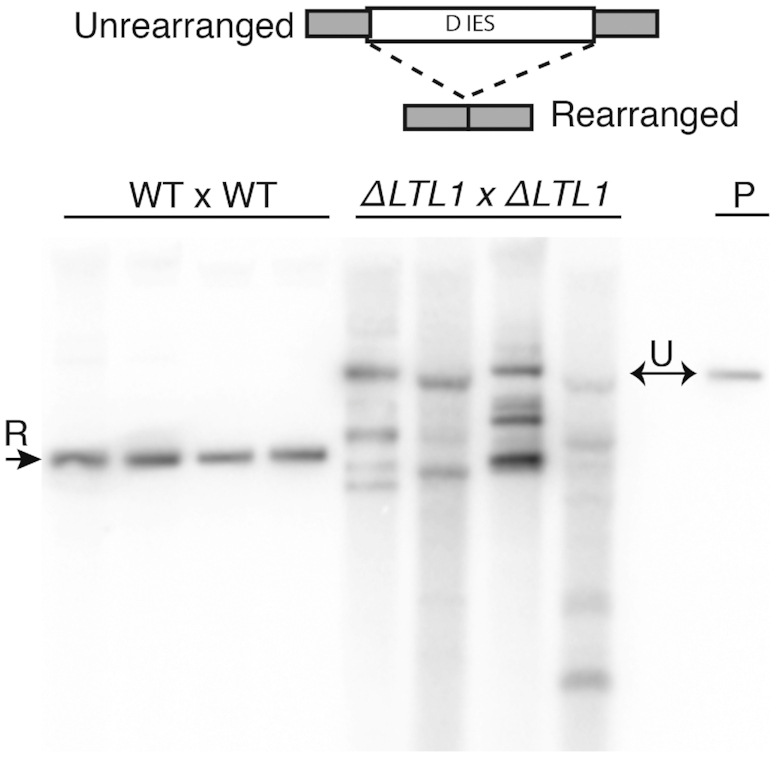
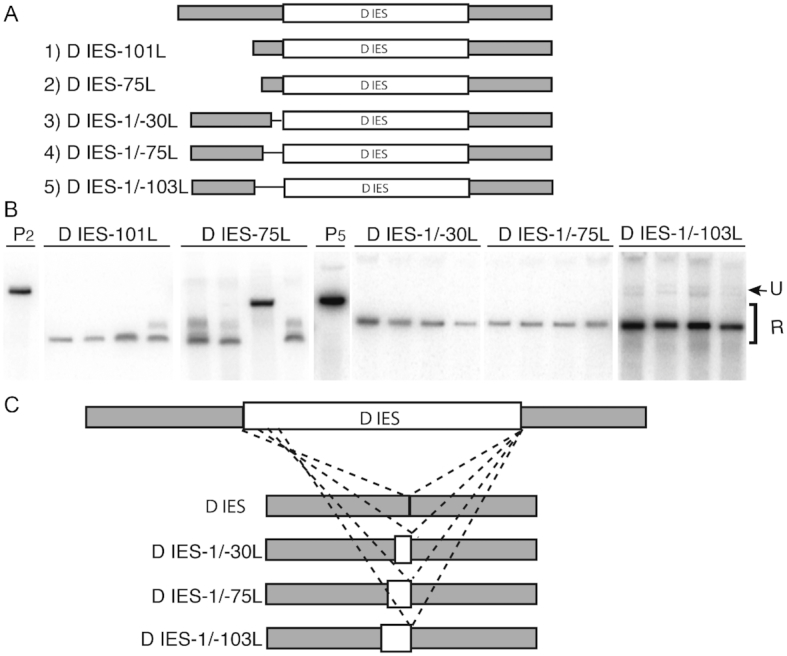
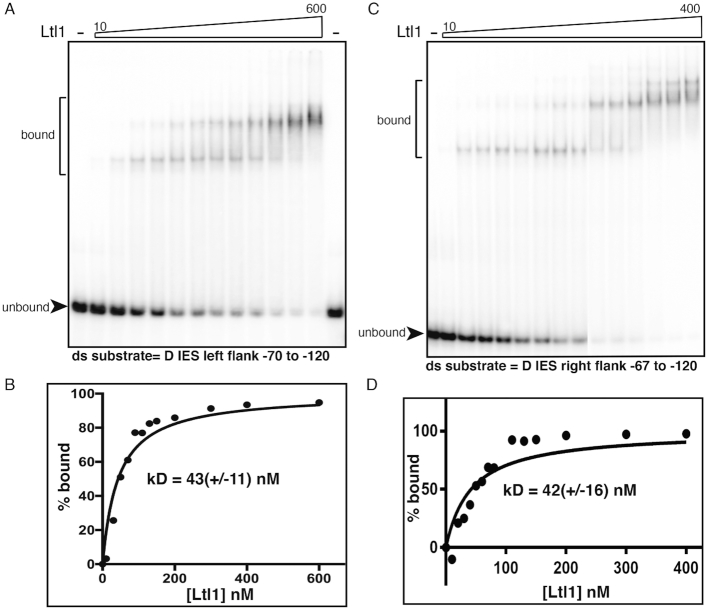
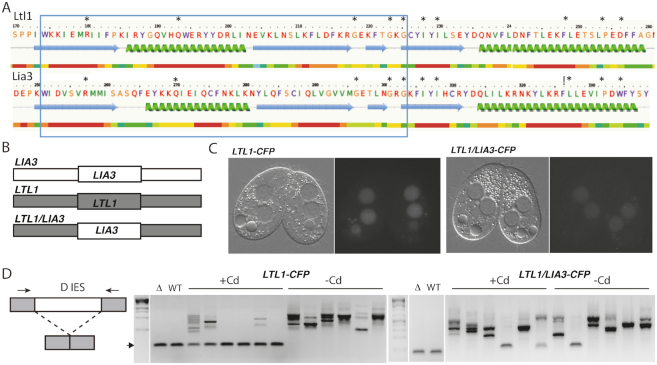
During differentiation of the Tetrahymena thermophila somatic nucleus, its germline-derived DNA undergoes extensive reorganization including the removal of ∼50 Mb from thousands of loci called internal eliminated sequences (IESs). IES-associated chromatin is methylated on lysines 9 and 27 of histone H3, marking newly formed heterochromatin for elimination. To ensure that this reorganized genome maintains essential coding and regulatory sequences, the boundaries of IESs must be accurately defined. In this study, we show that the developmentally expressed protein encoded by Lia3-Like 1 (LTL1) (Ttherm_00499370) is necessary to direct the excision boundaries of particular IESs. In ΔLTL1 cells, boundaries of eliminated loci are aberrant and heterogeneous. The IESs regulated by Ltl1 are distinct from those regulated by the guanine-quadruplex binding Lia3 protein. Ltl1 has a general affinity for double stranded DNA (Kd ∼ 350 nM) and binds specifically to a 50 bp A+T rich sequence flanking each side of the D IES (Kd ∼ 43 nM). Together these data reveal that Ltl1 and Lia3 control different subsets of IESs and that their mechanisms for flanking sequence recognition are distinct.


Figures

Figure 1.
Figure 1.
Ltl1 shares similarity with Lia3 and Tc3-related proteins. Schematic depicting the 417 amino acid (aa) coding region and the locations of two recognizable domains: the ∼100 aa region common to Lia3 and two other Lia3-like proteins (blue bar), and an amino terminus with similarity to the helix-turn-helix DNA binding domain found in Tc3 and related transposons (green oval). Asterisks denote aa's conserved across all Lia3-like proteins. Amino acids are colored based on similarity in properties.
Figure 2.
Figure 2.
Disruption of LTL1. (A) Southern blot analysis of genomic DNA isolated from both wild-type (WT) and ΔLTL1 after digestion with XbaI. Diagrams of the WT (LTL1) and ΔLTL1 (NEO3) alleles and the expected sizes of each after XbaI digestion are illustrated on the right. The black bar denotes the region corresponding to the radiolabeled probe. The expected positions of migration of WT and ΔLTL1 fragments are indicated by the solid and open left-facing arrowheads, respectively. (B, C) Reverse transcription PCR analysis of RNA isolated from WT and ΔLTL1 cells after 3, 6, 9, or 12 h of mating, vegetatively growing (V), or starving (S) cells. PCR was performed with primers amplifying (B) LTL1 or (C) the ubiquitously expressed HHP1 gene and using either cDNA (RT+), RNA w/o cDNA conversion (RT–), or genomic DNA (g). The open arrowhead indicates the expected size of amplified cDNA. HHP1 primers amplified a non-specific product (b) in these samples with or without cDNA conversion.
Figure 3.
Figure 3.
LTL1 is not required to complete mating and produce progeny. A diagram showing the typical stages and timing of Tetrahymena mating; percentages of paired cells at each time point at the indicated stage: white bars depict data from WT matings, black bars depict ΔLTL1 data. The progression of each mating was assessed 3 (top), 6 (middle) and 12 h (bottom) after mixing cells. The numbers at each stage was assessed by DAPI-staining DNA visualized by fluorescent microscopy; at least 100 pairs/single cells were counted for each mating at each time point.
Figure 4.
Figure 4.
Specific IESs exhibit excision defects in ΔLTL1 progeny. (A) Diagrams depict the rearrangements of loci containing the D and M IESs, examples of IESs whose normal rearrangements produce either a single major form or multiple alternative forms, respectively. Small arrows denote PCR primers flanking each IES used to amplify the loci from genomic DNA. (B, C) PCR amplification of IESs of wild-type, WT progeny, parental ΔLTL1 cells, and ΔLTL1 progeny was used to determine the accuracy of IES excision. Delta (Δ) symbols indicate the expected migration of products detected in the WT strains; brackets are used to indicated variable WT boundaries. Lanes B2 and 428 represent amplification of genomic DNA from the two WT strains B2086 and CU428, whose progeny are shown in WT × WT lanes 1–6; ΔLTL1 represent amplified genomic DNA from the two parental strains 4–2 and 5–2, whose progeny are shown in ΔLTL1 × ΔLTL1 lanes 1–6. IES rearrangement was judged to be (B) affected or (C) unaffected in ΔLTL1 progeny. Schematic shows the PCR amplified region. The left-most lane contains size standards; solid arrowheads denote the position of migration (250, 500 and 1000 bp fragments). (Note: failure to amplify products in ΔLTL1 progeny is indicative of aberrant excision resulting in loci that are too large to amplify under the given conditions or loss of sequences complementary to one or both PCR primers).
Figure 5.
Figure 5.
The D IES shows aberrant excision in ΔLTL1 mutants. Southern blot analysis of DNA isolated from four wild-type (WT) or ΔLTL1 progeny transformed with a D IES-containing plasmid to assess its rearrangement. A diagram depicting the rearrangement of the D IES is shown at the top. P, digested plasmid DNA used for transformation that shows the migration of the unrearranged (U) D IES. A single rearranged (R) form is visible in WT or multiple aberrant forms in mutant progeny.
Figure 6.
Figure 6.
Sequences flanking the D IES position its excision boundaries. (A) Deletion mutant constructs used to assess the importance of left-side flanking DNA in the rearrangement of the D IES. The rearrangement of a cloned copy containing several hundred bp of flanking DNA was shown in Figure 5. Constructs 1 and 2 truncate the left flanking DNA, Constructs 3–5 are internal deletions; construct names denote deletion endpoints. (B) Southern blot analysis of DNA isolated from progeny transformed with D IES-containing plasmids. P2 and P5, digested plasmid DNA containing constructs 2 and 5 used in the transformation show the migration of the unrearranged (U) D IES; rearranged (R) products migrating below the size of the transformed DNA. (C) DNA sequence analysis of internal deletion constructs is illustrated to show that the boundaries shift into the IES roughly the same distance and the sequences removed.
Figure 7.
Figure 7.
Ltl1 binds dsDNA from the region flanking the D IES. EMSA analysis was performed using increasing amounts of purified MBP-Ltl1 (indicated by the rightward sloping trapezoid) incubated with annealed 32P-labeled oligonucleotides corresponding to sequences between (A) –120 to –75 of the left flank or (C) –120 to –67 of the right flank of the D IES. The position of migration of unbound and bound probe DNA are indicated. (B, D) Probe binding was a measure and plotted as the % bound at increasing Ltl1 concentrations.
Figure 8.
Figure 8.
The conserved regions of Ltl1 and Lia3 are not interchangeable. (A) Phyre2 structural prediction was used to select the corresponding ∼50 amino acid region (indicated by the large box) to exchange to generate Ltl1/Lia3 chimeric proteins; note very similar predicted structures. Amino acid residues conserved in all four Lia3/Ltl proteins are denoted by asterisks. (B) Schematic showing the chimeric constructs that were fused to CFP and transformed into ΔLTL1 cells. WT and chimeric fusion proteins were expressed from the cadmium (Cd)-inducible MTT1 promoter. (C) Corresponding Differential Interference Constrast images and CFP fluorescence. (D) The schematic shows the D IES locus, which was monitored by PCR of genomic DNA isolated from the progeny of transformed cells to the right. Small arrows denote primers used to amplify the locus. Gel electrophoresis of D IES PCR products amplified from genomic DNA isolated from ΔLTL1 (Δ) or WT strains or the progeny of ΔLTL1 strains transformed with Ltl1-CFP or the chimeric expression construct as indicated. The arrowhead indicates the expected migration of PCR products corresponding to WT rearrangement products.

Similar articles

Cited by

References

    1. Nora E.P., Lajoie B.R., Schulz E.G., Giorgetti L., Okamoto I., Servant N., Piolot T., van Berkum N.L., Meisig J., Sedat J. et al. .. Spatial partitioning of the regulatory landscape of the X-inactivation centre. Nature. 2012; 485:381–385. - PMC - PubMed
    1. Dekker J., Heard E.. Structural and functional diversity of topologically associating domains. FEBS Lett. 2015; 589:2877–2884. - PMC - PubMed
    1. Dixon J.R., Gorkin D.U., Ren B.. Chromatin Domains: The unit of chromosome organization. Mol. Cell. 2016; 62:668–680. - PMC - PubMed
    1. Hamilton E.P., Kapusta A., Huvos P.E., Bidwell S.L., Zafar N., Tang H., Hadjithomas M., Krishnakumar V., Badger J.H., Caler E.V. et al. .. Structure of the germline genome of Tetrahymenathermophila and relationship to the massively rearranged somatic genome. eLife. 2016; 5:e19090. - PMC - PubMed
    1. Mochizuki K., Fine N.A., Fujisawa T., Gorovsky M.A.. Analysis of a piwi-related gene implicates small RNAs in genome rearrangement in tetrahymena. Cell. 2002; 110:689–699. - PubMed

Publication types

MeSH terms