

A novel conserved enhancer at zebrafish zic3 and zic6 loci drives neural expression
- PMID: 31194899
- PMCID: PMC6771876
- DOI: 10.1002/dvdy.69
A novel conserved enhancer at zebrafish zic3 and zic6 loci drives neural expression
Abstract
Background: Identifying enhancers and deciphering their putative roles represent a major step to better understand the mechanism of metazoan gene regulation, development, and the role of regulatory elements in disease. Comparative genomics and transgenic assays have been used with some success to identify critical regions that are involved in regulating the spatiotemporal expression of genes during embryogenesis.
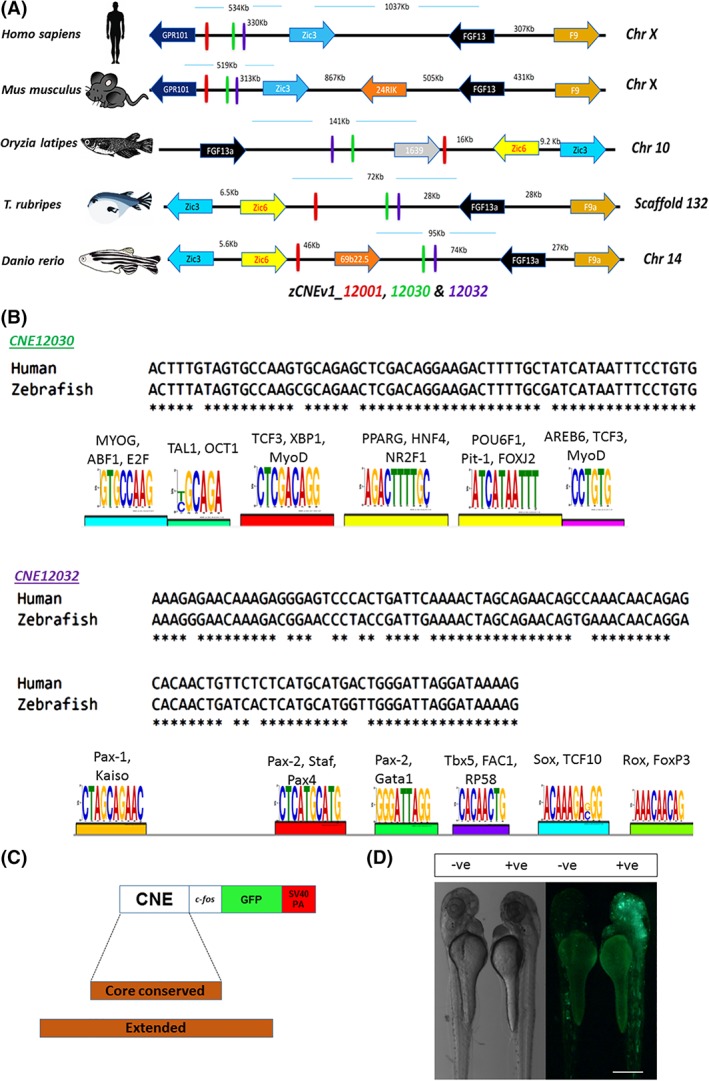
Results: We identified two novel tetrapod-teleost conserved noncoding elements within the vicinity of the zic3 and zic6 loci in the zebrafish genome and demonstrated their ability to drive tissue-specific expression in a transgenic zebrafish assay. The syntenic analysis and robust green fluorescent expression in the developing habenula in the stable transgenic line were correlated with known sites of endogenous zic3 and zic6 expression.
Conclusion: This transgenic line that expresses green fluorescent protein in the habenula is a valuable resource for studying a specific population of cells in the zebrafish central nervous system. Our observations indicate that a genomic sequence that is conserved between humans and zebrafish acts as an enhancer that likely controls zic3 and zic6 expression.
Keywords: cis-regulation; conserved noncoding elements; development; gene regulation; habenula; transgenic zebrafish.
© 2019 The Authors. Developmental Dynamics published by Wiley Periodicals, Inc. on behalf of American Association of Anatomists.
Conflict of interest statement
The authors declare no potential conflict of interest.
Figures


Similar articles
-
Expression of zebrafish pax6b in pancreas is regulated by two enhancers containing highly conserved cis-elements bound by PDX1, PBX and PREP factors.BMC Dev Biol. 2008 May 16;8:53. doi: 10.1186/1471-213X-8-53. BMC Dev Biol. 2008. PMID: 18485195 Free PMC article.
-
Genome wide analysis reveals Zic3 interaction with distal regulatory elements of stage specific developmental genes in zebrafish.PLoS Genet. 2013 Oct;9(10):e1003852. doi: 10.1371/journal.pgen.1003852. Epub 2013 Oct 31. PLoS Genet. 2013. PMID: 24204288 Free PMC article.
-
Comparative functional genomics revealed conservation and diversification of three enhancers of the isl1 gene for motor and sensory neuron-specific expression.Dev Biol. 2005 Feb 15;278(2):587-606. doi: 10.1016/j.ydbio.2004.11.031. Dev Biol. 2005. PMID: 15680372
-
Retroviral enhancer detection insertions in zebrafish combined with comparative genomics reveal genomic regulatory blocks - a fundamental feature of vertebrate genomes.Genome Biol. 2007;8 Suppl 1(Suppl 1):S4. doi: 10.1186/gb-2007-8-s1-s4. Genome Biol. 2007. PMID: 18047696 Free PMC article. Review.
-
Search for enhancers: teleost models in comparative genomic and transgenic analysis of cis regulatory elements.Bioessays. 2002 Jun;24(6):564-72. doi: 10.1002/bies.10096. Bioessays. 2002. PMID: 12111739 Review.
Cited by
-
Advances and Prospects in Understanding Vertebrate Cardiac Conduction System, Pacemaker Cell, and Cardiac Muscle Development: Toward Novel Biological Therapies.Muscles. 2023 Oct 12;2(4):338-352. doi: 10.3390/muscles2040026. Muscles. 2023. PMID: 40757530 Free PMC article. Review.
-
Identification of ancestral gnathostome Gli3 enhancers with activity in mammals.Dev Growth Differ. 2024 Jan;66(1):75-88. doi: 10.1111/dgd.12901. Epub 2023 Dec 20. Dev Growth Differ. 2024. PMID: 37925606 Free PMC article.
References
-
- Lettice LA, Heaney SJ, Purdie LA, et al. A long‐range Shh enhancer regulates expression in the developing limb and fin and is associated with preaxial polydactyly. Hum Mol Genet. 2003;12:1725‐1735. - PubMed
-
- Minhas R, Pauls S, Ali S, et al. Cis‐regulatory control of human GLI2 expression in the developing neural tube and limb bud. Dev Dyn. 2015;244:681‐692. - PubMed
-
- Carroll SB, Prud'homme B, Gompel N. Regulating evolution. Sci Am. 2008;298:60‐67. - PubMed
Publication types
MeSH terms
Substances
LinkOut - more resources
Full Text Sources
Molecular Biology Databases
