

Effects of ritonavir-boosted protease inhibitors on combined oral contraceptive pharmacokinetics and pharmacodynamics in HIV-positive women
- PMID: 31194965
- PMCID: PMC6778019
- DOI: 10.1016/j.contraception.2019.06.002
Effects of ritonavir-boosted protease inhibitors on combined oral contraceptive pharmacokinetics and pharmacodynamics in HIV-positive women
Abstract
Objective: To assess the pharmacokinetics of combined oral contraceptive (COC) components and prevalence of ovulation in HIV-positive women using ritonavir-containing antiretroviral regimens compared to those using regimens previously found not to interact with COCs or not using any antiretrovirals.
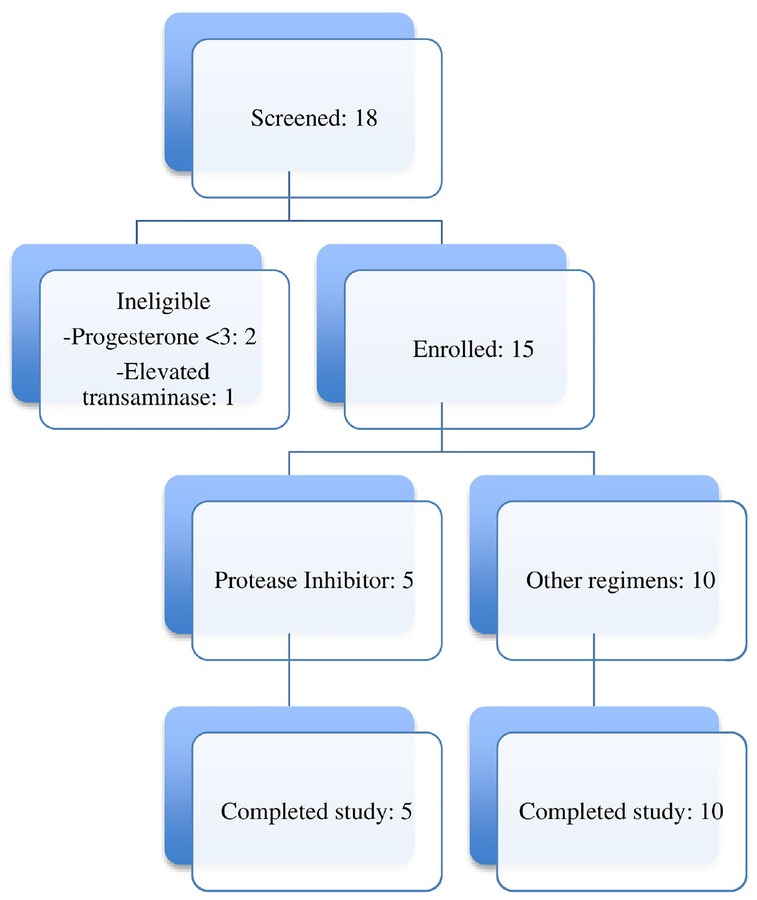
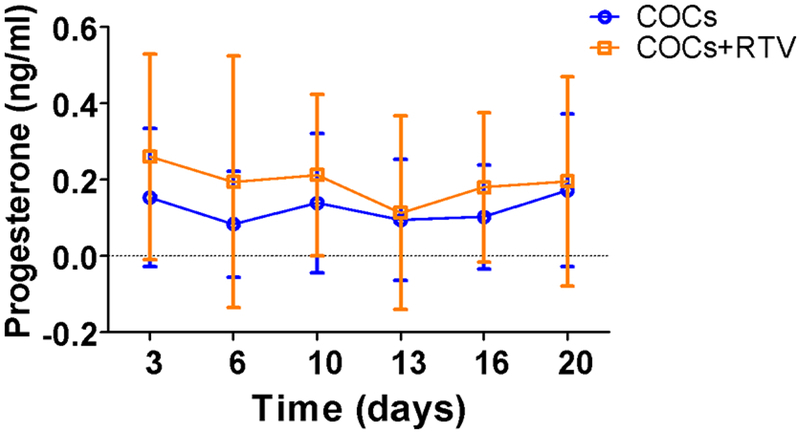
Study design: We conducted a prospective cohort pharmacokinetic pilot study comparing the pharmacokinetics of levonorgestrel (LNG) and ethinyl estradiol (EE) in HIV-positive women taking ritonavir-containing antiretroviral regimens to those in women using non-ritonavir-containing regimens or no antiretrovirals. Participants received COCs containing LNG/EE 150/30 mcg for 21 days. Beginning day 21, we collected serial blood samples over 72 h. The primary outcome was area under the curve (AUC) of LNG, with secondary outcomes including other LNG pharmacokinetic measures, EE pharmacokinetics and ovulation as measured by serum progesterone.
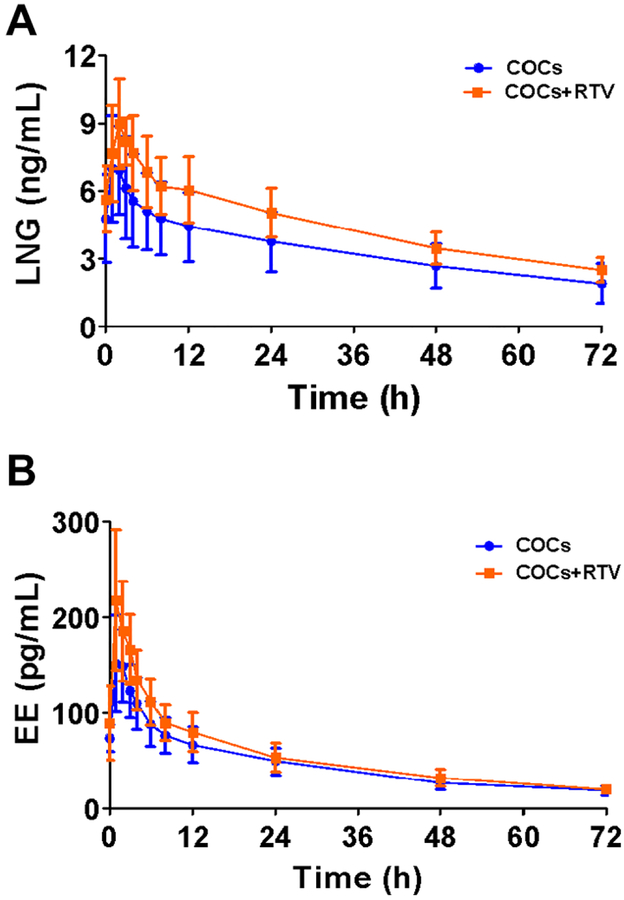
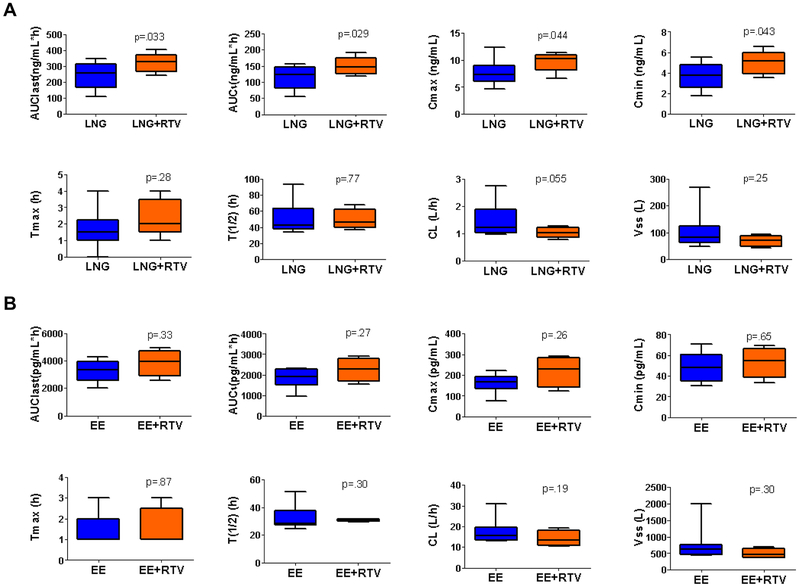
Results: Pharmacokinetic parameters of LNG showed a trend toward increased exposure in women on ritonavir. LNG AUClast increased by 32.6% (312±60.9 vs. 243±82.6 ng/mL*h, p=.033, n=5) in women taking ritonavir compared to the control group (n=10). The Cmax (9.68±1.81 vs. 7.62±2.29 ng/mL) and Cmin (4.97±1.15 vs. 3.70±1.29 ng/mL) were also higher in the ritonavir arm. After excluding the inconsistent users (n=2), CL of LNG was reduced in the ritonavir arm (p=.032). EE pharmacokinetic profiles were not different between groups. The progesterone concentrations were similar in women of both groups, and none were consistent with ovulation during the treatment cycle.
Conclusion: Women on ritonavir showed an approximately 30% increase in LNG exposure but no difference in EE exposure.
Implications: The current data suggest that ritonavir does not have a clinically significant impact on oral contraceptive pharmacokinetics.
Keywords: Clearance; Combined oral contraceptives; HIV-positive; Pharmacokinetics; Volume of distribution.
Copyright © 2019 Elsevier Inc. All rights reserved.
Figures
References
-
- The Joint United Nations Programme on HIV/AIDS. wwwunaidsorg.Accessed on September 17, 2018. - PubMed
-
- Prevention CfDC. Estimated HIV incidence and prevalence in the United States, 2010–2015. HIV Surveillance Supplemental Report 2018; 23 (No. 1).
-
- Centers for Disease Control and Prevention. US Medical Eligibility Criteria for Contraceptive Use. 2016;MMWR:1–108.
-
- Department of Health U.S. and Human Services Food and Drug Administration. Guidance for Industry Drug Interaction Studies-Study Design Data Analysis and Implications for Dosing and Labeling. Clinical Pharmacology. September 2006.
-
- Edelman AB, Cherala G, Stanczyk FZ. Metabolism and pharmacokinetics of contraceptive steroids in obese women: a review. Contraception. 2010;82:314–23. - PubMed
Publication types
MeSH terms
Substances
Grants and funding
LinkOut - more resources
Full Text Sources
