

Effects of Methylmercury and Theaflavin Digallate on Adipokines in Mature 3T3-L1 Adipocytes
- PMID: 31195622
- PMCID: PMC6600166
- DOI: 10.3390/ijms20112755
Effects of Methylmercury and Theaflavin Digallate on Adipokines in Mature 3T3-L1 Adipocytes
Abstract
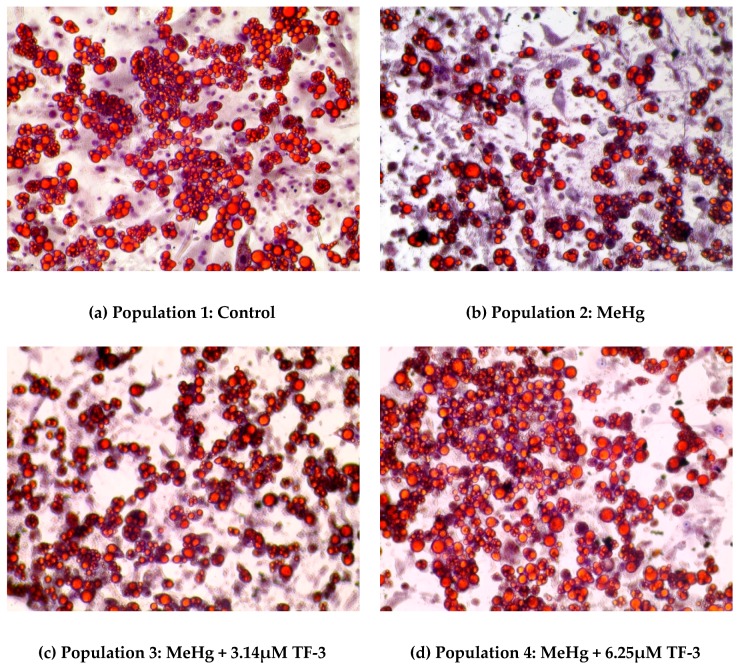
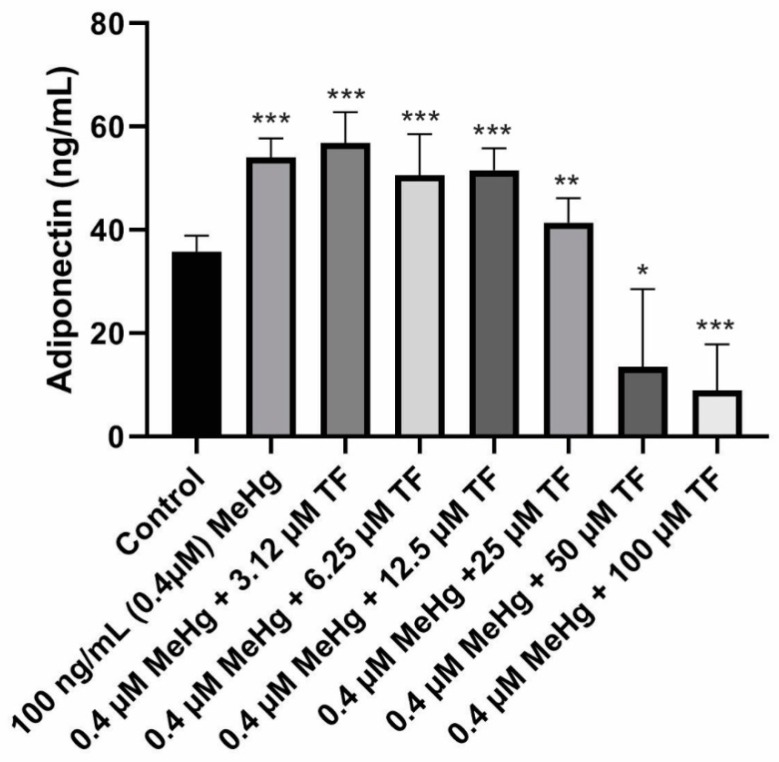
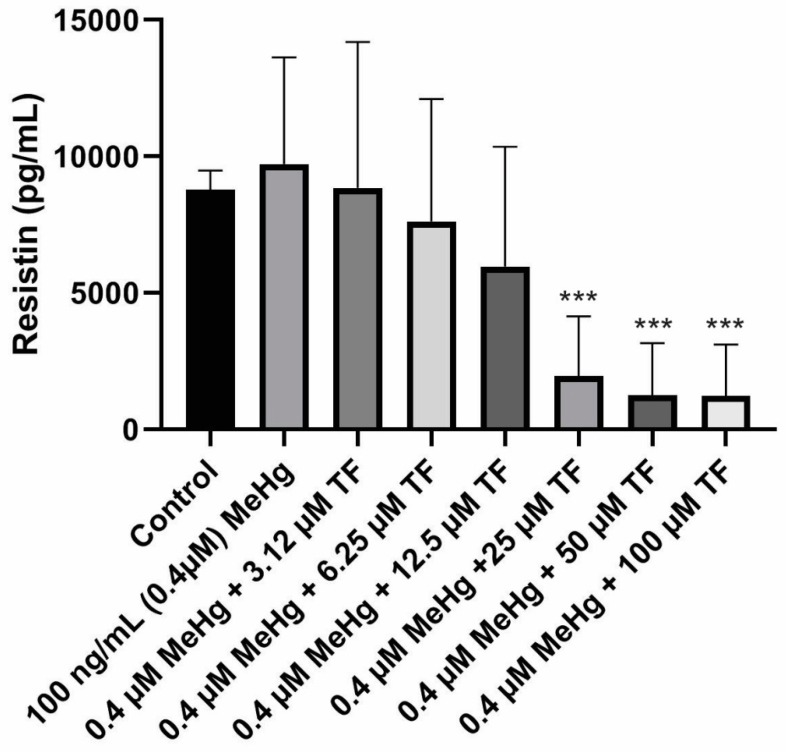
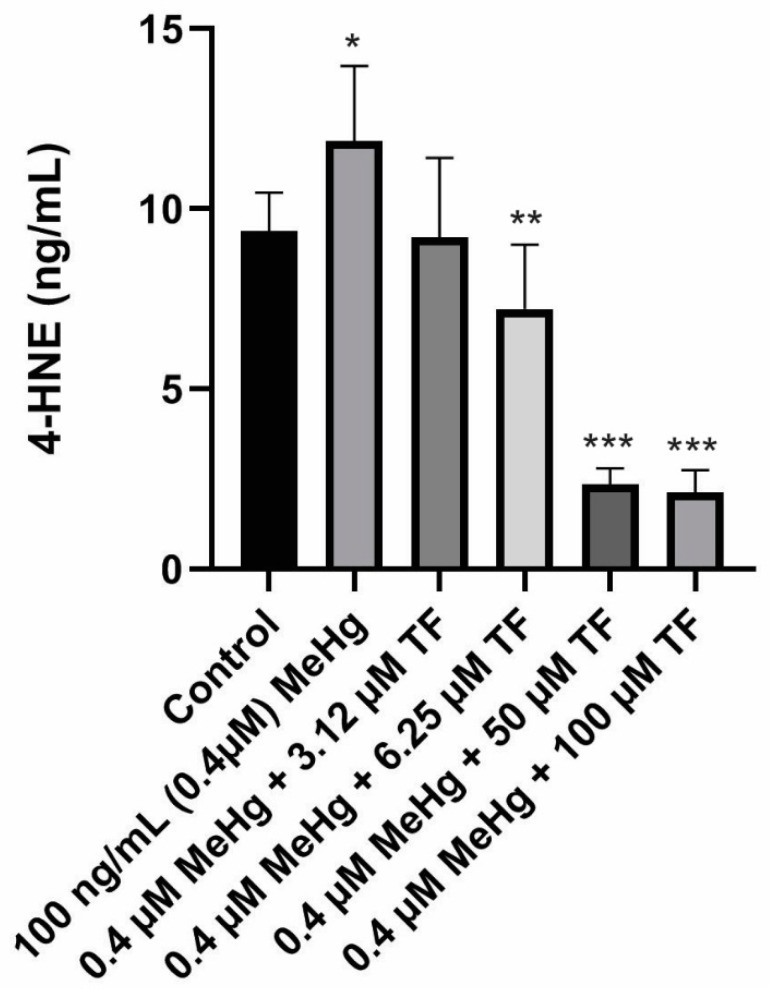
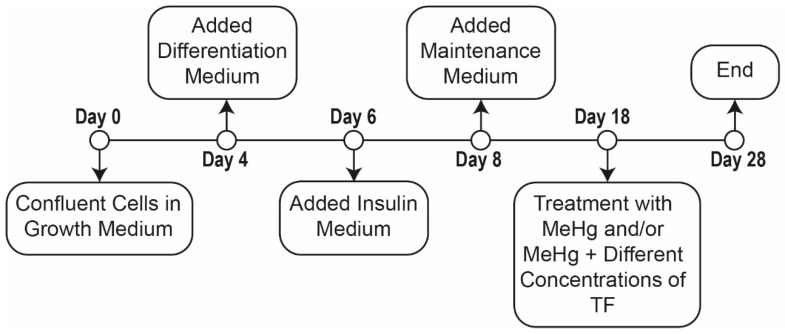
Diabetes is a contributor to morbidity across the globe and is often associated with obesity, metabolic syndrome and other inflammatory diseases associated with aging. In addition to genetic and lifestyle factors, environmental factors such as metals and persistent organic pollutants may increase the severity or lower the threshold of these conditions. In cell culture, methylmercury is toxic to adipocytes and may impact adipokine secretions. In this study, we determined the effects of different concentrations of theaflavin digallate on methylmercury exposed 3T3-L1 adipocytes in cell culture. Secretions of resistin, adiponectin and lipid peroxidation product, 4-hydroxynonenal (4-HNE) were monitored using ELISA assays. Cell morphology of methylmercury and theaflavin-3,3'-digallate treated adipocytes was assessed using Lipid (Oil Red O) staining. Exposure to methylmercury increased the levels of resistin and adiponectin as well as 4-HNE when compared to the control cells. Methylmercury treated cells resulted in smaller number of adipocytes and clumped lipid droplets. These results suggest that methylmercury induces reactive oxygen species leading to development of an inflammatory response. Theaflavin-3,3'-digallate reduced the impact of methylmercury by maintaining the adipocytes morphology and secretion patterns of adiponectin, resistin and 4-hydroxynonenal. With this experimental model system other anti-inflammatory and signaling agents could be tested at the biochemical level before eventually leading to studies in animal models.
Keywords: adipokines; adiponectin; diabetes; lipid peroxidation; methylmercury; resistin; theaflavin digallate.
Conflict of interest statement
The authors declare no conflict of interest.
Figures
Similar articles
-
Cyclolepis genistoides D. Don (palo azul) promotes differentiation of adipocytes and regulates adipokine expression.Nutr Res. 2013 Nov;33(11):922-31. doi: 10.1016/j.nutres.2013.07.012. Epub 2013 Aug 15. Nutr Res. 2013. PMID: 24176232
-
Effect of PPAR-delta agonist on the expression of visfatin, adiponectin, and resistin in rat adipose tissue and 3T3-L1 adipocytes.Biochem Biophys Res Commun. 2007 May 25;357(1):62-7. doi: 10.1016/j.bbrc.2007.03.114. Epub 2007 Mar 28. Biochem Biophys Res Commun. 2007. PMID: 17418807
-
Effects of 17β-estradiol and progesterone on the production of adipokines in differentiating 3T3-L1 adipocytes: Role of Rho-kinase.Cytokine. 2015 Apr;72(2):130-4. doi: 10.1016/j.cyto.2014.12.020. Epub 2015 Jan 31. Cytokine. 2015. PMID: 25647267
-
GW4064, a farnesoid X receptor agonist, upregulates adipokine expression in preadipocytes and HepG2 cells.World J Gastroenterol. 2014 Nov 14;20(42):15727-35. doi: 10.3748/wjg.v20.i42.15727. World J Gastroenterol. 2014. PMID: 25400456 Free PMC article.
-
Metabolic Messengers: Adiponectin.Nat Metab. 2019 Mar;1(3):334-339. doi: 10.1038/s42255-019-0041-z. Epub 2019 Mar 14. Nat Metab. 2019. PMID: 32661510 Free PMC article. Review.
Cited by
-
Adipotropic effects of heavy metals and their potential role in obesity.Fac Rev. 2021 Mar 26;10:32. doi: 10.12703/r/10-32. eCollection 2021. Fac Rev. 2021. PMID: 33977285 Free PMC article. Review.
-
Mercury Is Taken Up Selectively by Cells Involved in Joint, Bone, and Connective Tissue Disorders.Front Med (Lausanne). 2019 Jul 19;6:168. doi: 10.3389/fmed.2019.00168. eCollection 2019. Front Med (Lausanne). 2019. PMID: 31380381 Free PMC article.
-
Association of Blood Total Mercury with Dyslipidemia in a sample of U.S. Adolescents: Results from the National Health and Nutrition Examination Survey Database, 2011-2018.Hyg Environ Health Adv. 2023 Jun;6:100047. doi: 10.1016/j.heha.2023.100047. Epub 2023 Feb 4. Hyg Environ Health Adv. 2023. PMID: 38617034 Free PMC article.
-
Differential fat accumulation in early adulthood according to adolescent-BMI and heavy metal exposure.New Dir Child Adolesc Dev. 2022 Mar;2022(181-182):37-51. doi: 10.1002/cad.20463. Epub 2022 May 19. New Dir Child Adolesc Dev. 2022. PMID: 35583253 Free PMC article.
-
Trace Elements-Role in Joint Function and Impact on Joint Diseases.Int J Mol Sci. 2025 Aug 2;26(15):7493. doi: 10.3390/ijms26157493. Int J Mol Sci. 2025. PMID: 40806618 Free PMC article. Review.
References
-
- United States Environmental Protection Agency Mercury Study Report to Congress. [(accessed on 19 October 2015)]; Available online: https://www.epa.gov/mercury/mercury-study-report-congress.
-
- Loring P.A., Duffy L.K. Managing Environmental Risks: The Benefits of a Place-Based Approach. Rural Remote Health. 2011;11:1800–1808. - PubMed
MeSH terms
Substances
LinkOut - more resources
Full Text Sources
Other Literature Sources
