

A Dynamical and Zero-Inflated Negative Binomial Regression Modelling of Malaria Incidence in Limpopo Province, South Africa
- PMID: 31195637
- PMCID: PMC6603991
- DOI: 10.3390/ijerph16112000
A Dynamical and Zero-Inflated Negative Binomial Regression Modelling of Malaria Incidence in Limpopo Province, South Africa
Abstract
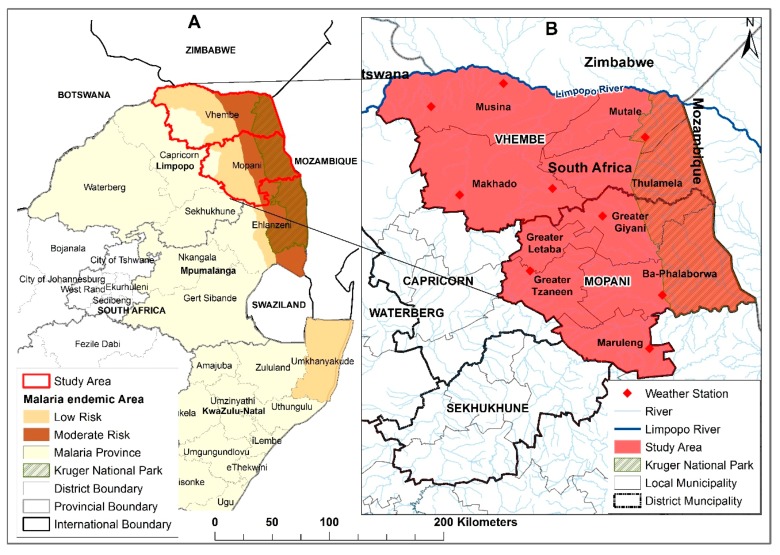
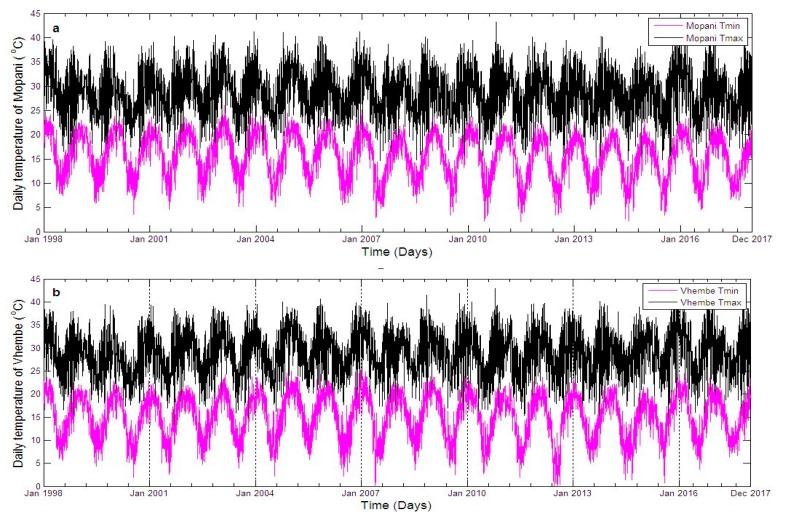
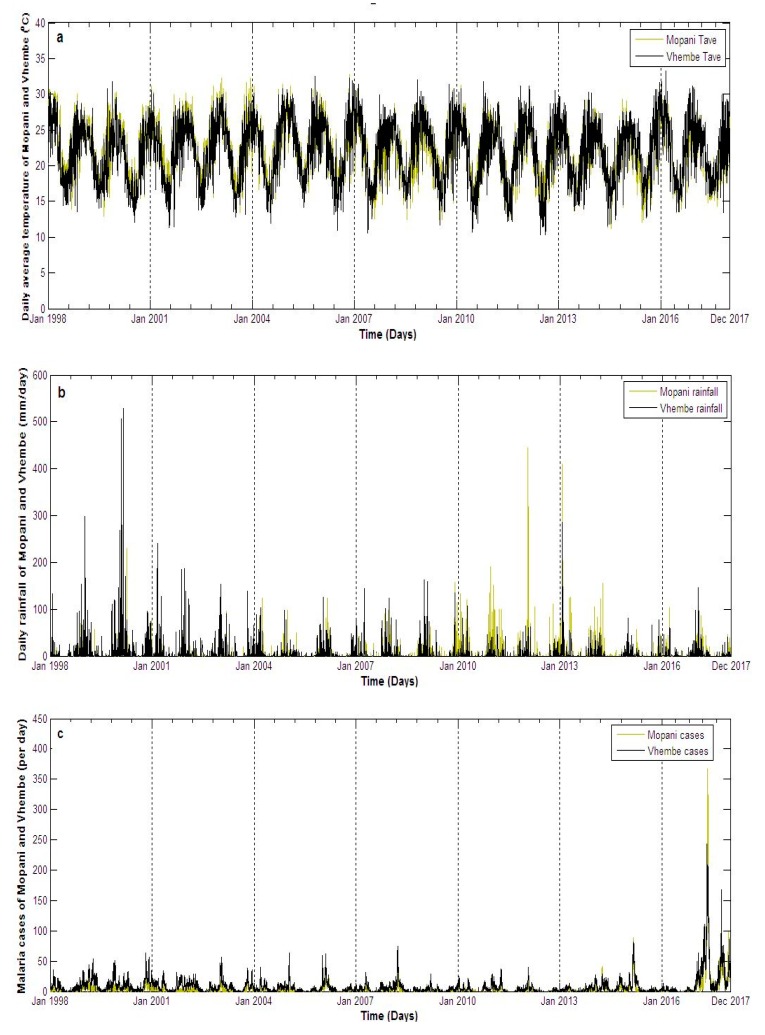
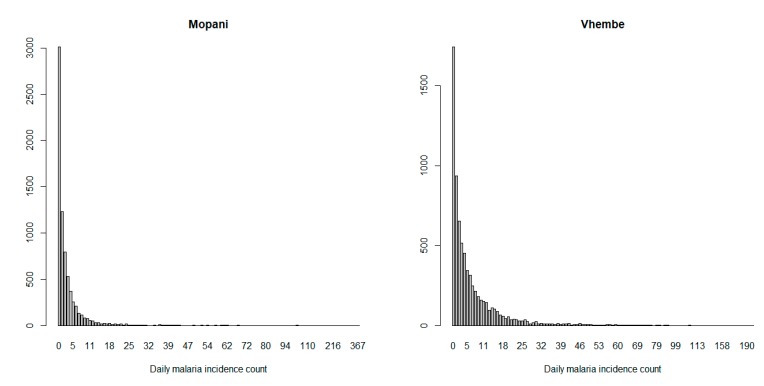
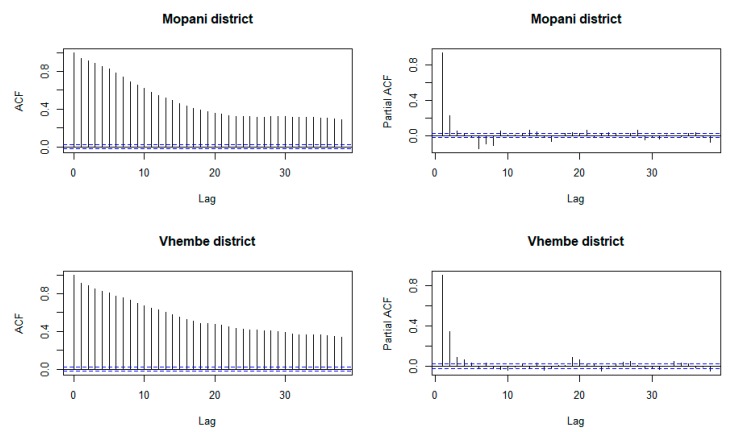
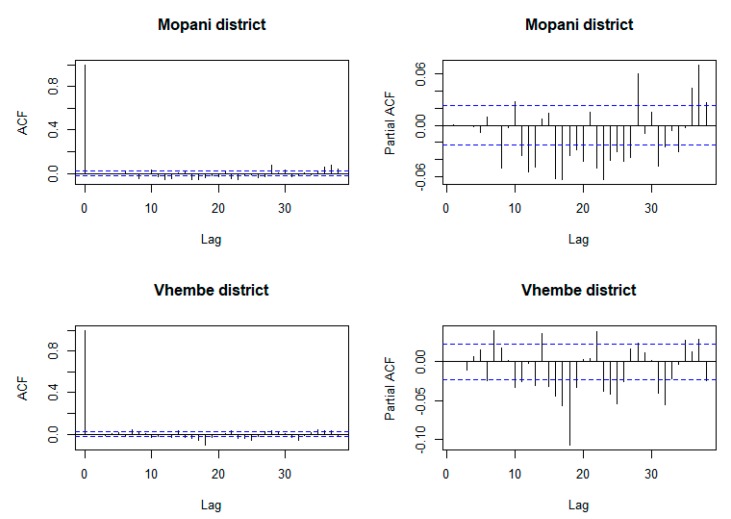
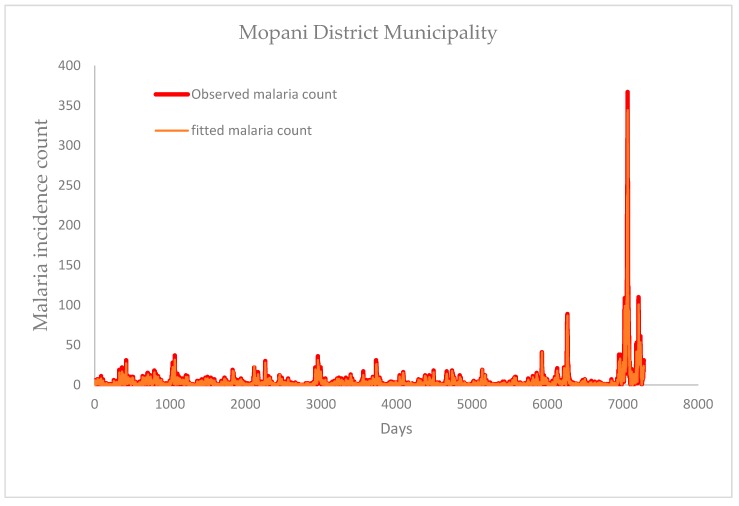
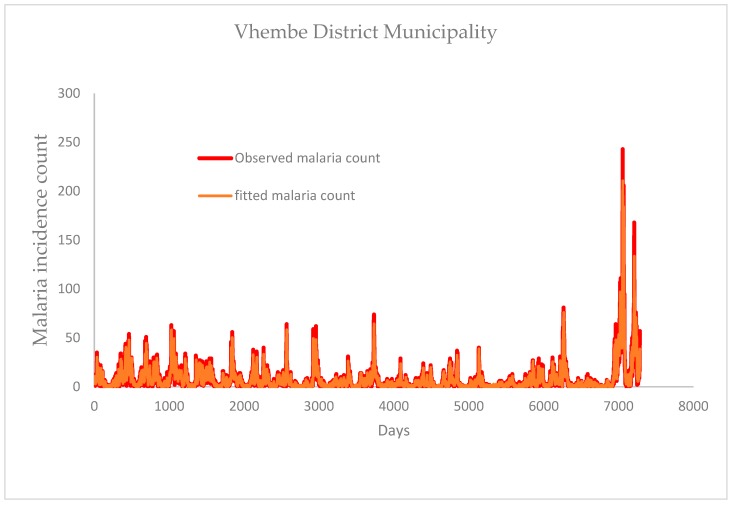
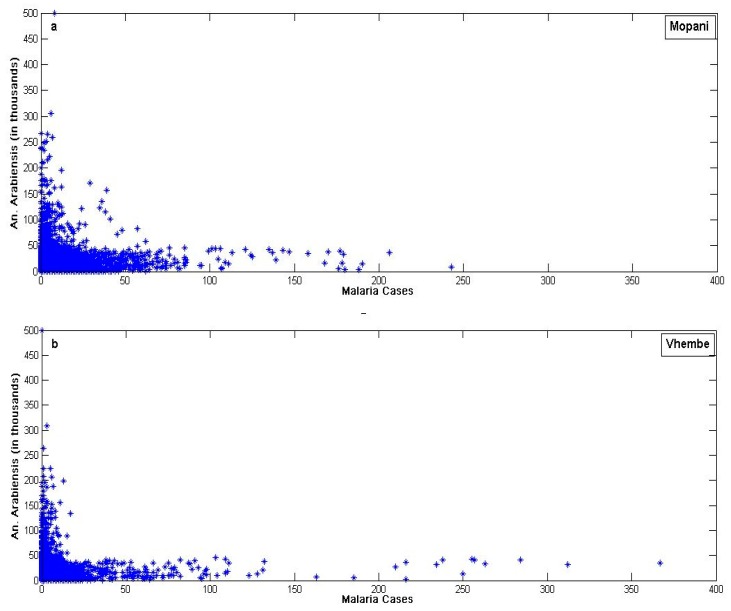
Recent studies have considered the connections between malaria incidence and climate variables using mathematical and statistical models. Some of the statistical models focused on time series approach based on Box-Jenkins methodology or on dynamic model. The latter approach allows for covariates different from its original lagged values, while the Box-Jenkins does not. In real situations, malaria incidence counts may turn up with many zero terms in the time series. Fitting time series model based on the Box-Jenkins approach and ARIMA may be spurious. In this study, a zero-inflated negative binomial regression model was formulated for fitting malaria incidence in Mopani and Vhembe-two of the epidemic district municipalities in Limpopo, South Africa. In particular, a zero-inflated negative binomial regression model was formulated for daily malaria counts as a function of some climate variables, with the aim of identifying the model that best predicts reported malaria cases. Results from this study show that daily rainfall amount and the average temperature at various lags have a significant influence on malaria incidence in the study areas. The significance of zero inflation on the malaria count was examined using the Vuong test and the result shows that zero-inflated negative binomial regression model fits the data better. A dynamical climate-based model was further used to investigate the population dynamics of mosquitoes over the two regions. Findings highlight the significant roles of Anopheles arabiensis on malaria transmission over the regions and suggest that vector control activities should be intense to eradicate malaria in Mopani and Vhembe districts. Although An. arabiensis has been identified as the major vector over these regions, our findings further suggest the presence of additional vectors transmitting malaria in the study regions. The findings from this study offer insight into climate-malaria incidence linkages over Limpopo province of South Africa.
Keywords: Mopani; Vhembe; climate; dynamical models; malaria; zero inflated negative binomial regression.
Conflict of interest statement
The authors declare that they have no competing interests.
Figures
Similar articles
-
Modelling Malaria Incidence in the Limpopo Province, South Africa: Comparison of Classical and Bayesian Methods of Estimation.Int J Environ Res Public Health. 2020 Jul 13;17(14):5016. doi: 10.3390/ijerph17145016. Int J Environ Res Public Health. 2020. PMID: 32668606 Free PMC article.
-
Malaria Vectors and Vector Surveillance in Limpopo Province (South Africa): 1927 to 2018.Int J Environ Res Public Health. 2020 Jun 9;17(11):4125. doi: 10.3390/ijerph17114125. Int J Environ Res Public Health. 2020. PMID: 32527067 Free PMC article. Review.
-
Rainfall Trends and Malaria Occurrences in Limpopo Province, South Africa.Int J Environ Res Public Health. 2019 Dec 17;16(24):5156. doi: 10.3390/ijerph16245156. Int J Environ Res Public Health. 2019. PMID: 31861127 Free PMC article.
-
Exploring the Influence of Daily Climate Variables on Malaria Transmission and Abundance of Anopheles arabiensis over Nkomazi Local Municipality, Mpumalanga Province, South Africa.J Environ Public Health. 2018 Oct 9;2018:3143950. doi: 10.1155/2018/3143950. eCollection 2018. J Environ Public Health. 2018. PMID: 30584427 Free PMC article.
-
Modelling climate change and malaria transmission.Adv Exp Med Biol. 2010;673:184-99. doi: 10.1007/978-1-4419-6064-1_13. Adv Exp Med Biol. 2010. PMID: 20632538 Review.
Cited by
-
COVID-19 incidence and mortality in Nigeria: gender based analysis.PeerJ. 2021 Feb 12;9:e10613. doi: 10.7717/peerj.10613. eCollection 2021. PeerJ. 2021. PMID: 33614262 Free PMC article.
-
Towards malaria elimination: analysis of travel history and case forecasting using the SARIMA model in Limpopo Province.Parasitol Res. 2023 Aug;122(8):1775-1785. doi: 10.1007/s00436-023-07870-y. Epub 2023 Jun 13. Parasitol Res. 2023. PMID: 37310511 Free PMC article.
-
Modelling Malaria Incidence in the Limpopo Province, South Africa: Comparison of Classical and Bayesian Methods of Estimation.Int J Environ Res Public Health. 2020 Jul 13;17(14):5016. doi: 10.3390/ijerph17145016. Int J Environ Res Public Health. 2020. PMID: 32668606 Free PMC article.
-
Generalized Linear Models to Forecast Malaria Incidence in Three Endemic Regions of Senegal.Int J Environ Res Public Health. 2023 Jul 5;20(13):6303. doi: 10.3390/ijerph20136303. Int J Environ Res Public Health. 2023. PMID: 37444150 Free PMC article.
-
Geo-epidemiology of malaria incidence in the Vhembe District to guide targeted elimination strategies, South-Africa, 2015-2018: a local resurgence.Sci Rep. 2023 Jul 8;13(1):11049. doi: 10.1038/s41598-023-38147-0. Sci Rep. 2023. PMID: 37422504 Free PMC article.
References
-
- World Health Organization WHO Update, World Malaria Report. [(accessed on 4 June 2019)];2018 Available online: http://www.who.int/mediacentre/factsheets/fs094/en/
-
- National Institute for Communicable Diseases (NICD) Update. [(accessed on 4 June 2019)];2017 Available online: http://www.nicd.ac.za/wp-content/uploads/2017/05/Malaria-update.pdf.
-
- Adeola A.M., Botai J.O., Rautenbach H., Adisa O.M., Ncongwane K.P., Botai C.M., Adebayo-Ojo T.C. Climatic Variables and Malaria Morbidity in Mutale Local Municipality, South Africa: A 19-Year Data Analysis. Int. J. Environ. Res. Public Health. 2017;14:1360. doi: 10.3390/ijerph14111360. - DOI - PMC - PubMed
-
- Munhenga G., Brooke B.D., Spillings B., Essop L., Hunt R.H., Midzi S., Govender D., Braack L., Koekemoer L.L. Field study site selection, species abundance and monthly distribution of Anopheline mosquitoes in the northern Kruger National Park, South Africa. Malar. J. 2014;13:27. doi: 10.1186/1475-2875-13-27. - DOI - PMC - PubMed
