

Transcriptome Profile Analysis of Winter Rapeseed (Brassica napus L.) in Response to Freezing Stress, Reveal Potentially Connected Events to Freezing Stress
- PMID: 31195741
- PMCID: PMC6600501
- DOI: 10.3390/ijms20112771
Transcriptome Profile Analysis of Winter Rapeseed (Brassica napus L.) in Response to Freezing Stress, Reveal Potentially Connected Events to Freezing Stress
Abstract
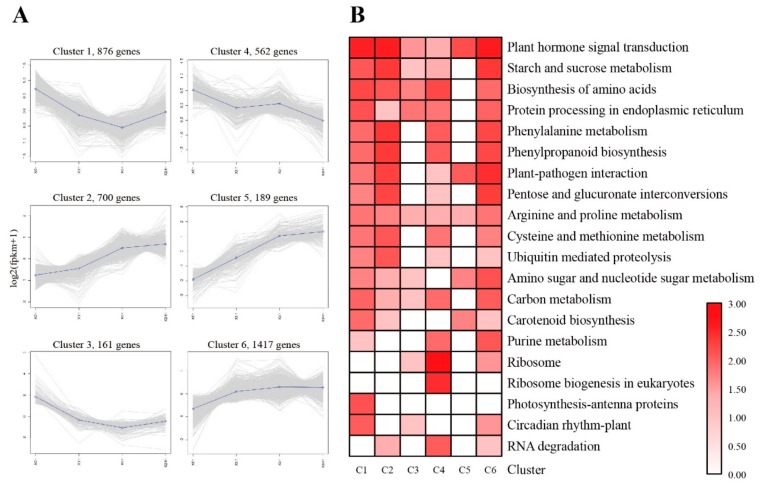
Winter rapeseed is not only an important oilseed crop, but also a winter cover crop in Northern China, where its production was severely limited by freezing stress. As an overwinter crop, the production is severely limited by freezing stress. Therefore, understanding the physiological and molecular mechanism of winter rapeseed (Brassica napus L.) in freezing stress responses becomes essential for the improvement and development of freezing-tolerant varieties of Brassica napus. In this study, morphological, physiological, ultrastructure and transcriptome changes in the Brassica napus line "2016TS(G)10" (freezing-tolerance line) that was exposed to -2 °C for 0 h, 1 h, 3 h and 24 h were characterized. The results showed that freezing stress caused seedling dehydration, and chloroplast dilation and degradation. The content of malondialdehyde (MDA), proline, soluble protein and soluble sugars were increased, as well as the relative electrolyte leakage (REL) which was significantly increased at frozen 24 h. Subsequently, RNA-seq analysis revealed a total of 98,672 UniGenes that were annotated in Brassica napus and 3905 UniGenes were identified as differentially expressed genes after being exposed to freezing stress. Among these genes, 2312 (59.21%) were up-regulated and 1593 (40.79%) were down-regulated. Most of these DEGs were significantly annotated in the carbohydrates and energy metabolism, signal transduction, amino acid metabolism and translation. Most of the up-regulated DEGs were especially enriched in plant hormone signal transduction, starch and sucrose metabolism pathways. Transcription factor enrichment analysis showed that the AP2/ERF, WRKY and MYB families were also significantly changed. Furthermore, 20 DEGs were selected to validate the transcriptome profiles via quantitative real-time PCR (qRT-PCR). In conclusion, the results provide an overall view of the dynamic changes in physiology and insights into the molecular regulation mechanisms of winter Brassica napus in response to freezing treatment, expanding our understanding on the complex molecular mechanism in plant response to freezing stress.
Keywords: freezing stress; morphology; physiological; transcriptomic; ultrastructure.
Conflict of interest statement
The authors declare no conflict of interest.
Figures


Similar articles
-
Comparative Transcriptome Analyses Revealed Conserved and Novel Responses to Cold and Freezing Stress in Brassica napus L.G3 (Bethesda). 2019 Aug 8;9(8):2723-2737. doi: 10.1534/g3.119.400229. G3 (Bethesda). 2019. PMID: 31167831 Free PMC article.
-
Comparative Analysis of the Brassica napus Root and Leaf Transcript Profiling in Response to Drought Stress.Int J Mol Sci. 2015 Aug 11;16(8):18752-77. doi: 10.3390/ijms160818752. Int J Mol Sci. 2015. PMID: 26270661 Free PMC article.
-
Integrated methylome and transcriptome analysis unravel the cold tolerance mechanism in winter rapeseed(Brassica napus L.).BMC Plant Biol. 2022 Aug 26;22(1):414. doi: 10.1186/s12870-022-03797-1. BMC Plant Biol. 2022. PMID: 36008781 Free PMC article.
-
Omics: The way forward to enhance abiotic stress tolerance in Brassica napus L.GM Crops Food. 2021 Jan 2;12(1):251-281. doi: 10.1080/21645698.2020.1859898. GM Crops Food. 2021. PMID: 33464960 Free PMC article. Review.
-
The Use of Genetic and Gene Technologies in Shaping Modern Rapeseed Cultivars (Brassica napus L.).Genes (Basel). 2020 Sep 30;11(10):1161. doi: 10.3390/genes11101161. Genes (Basel). 2020. PMID: 33008008 Free PMC article. Review.
Cited by
-
Effects of exogenous calcium and calcium inhibitor on physiological characteristics of winter turnip rape (Brassica rapa) under low temperature stress.BMC Plant Biol. 2024 Oct 9;24(1):937. doi: 10.1186/s12870-024-05556-w. BMC Plant Biol. 2024. PMID: 39385096 Free PMC article.
-
Transcriptome and Metabolome Analysis Revealed the Freezing Resistance Mechanism in 60-Year-Old Overwintering Camellia sinensis.Biology (Basel). 2021 Oct 3;10(10):996. doi: 10.3390/biology10100996. Biology (Basel). 2021. PMID: 34681095 Free PMC article.
-
Transcriptomic Profiling of Young Cotyledons Response to Chilling Stress in Two Contrasting Cotton (Gossypium hirsutum L.) Genotypes at the Seedling Stage.Int J Mol Sci. 2020 Jul 19;21(14):5095. doi: 10.3390/ijms21145095. Int J Mol Sci. 2020. PMID: 32707667 Free PMC article.
-
Differential alternative splicing genes and isoform co-expression networks of Brassica napus under multiple abiotic stresses.Front Plant Sci. 2022 Oct 13;13:1009998. doi: 10.3389/fpls.2022.1009998. eCollection 2022. Front Plant Sci. 2022. PMID: 36311064 Free PMC article.
-
Systematic Analysis of the BrHAT Gene Family and Physiological Characteristics of Brassica rapa L. Treated with Histone Acetylase and Deacetylase Inhibitors under Low Temperature.Int J Mol Sci. 2024 Aug 24;25(17):9200. doi: 10.3390/ijms25179200. Int J Mol Sci. 2024. PMID: 39273148 Free PMC article.
References
-
- Zhang X.K., Zhang C.L., Liao X., Wang H.Z. Investigation on 2008’low temperature and freeze injure on winter rape along Yangtze River. Chin. J. Crop Sci. 2008;30:122–126.
MeSH terms
Grants and funding
LinkOut - more resources
Full Text Sources
Molecular Biology Databases
Research Materials
